Advertisements
Advertisements
Question
A: Assertion: Increase in the dependency ratio will affect the economy.
R: Reasoning: Medical costs are high when there are more elderly in the population.
Options
Only A is correct
Only R is correct
Both A and R are correct and R is the correct explanation of A.
Both A and R are correct but R is not the correct explanation of A.
Advertisements
Solution
Both A and R are correct and R is the correct explanation of A.
Explanation:
An increase in the dependency ratio affects the economy because there are more non-working people (like the elderly) depending on the working population.
Medical costs are high when there are more elderly people, and this adds financial pressure on the economy.
So, the reason (R) correctly explains the assertion (A)
APPEARS IN
RELATED QUESTIONS
Write a short note on:
Population pyramid and sex ratio.
Give a geographical reason:
Demographic dividend increases when the proportion of the working population increases.
Which one of the following is the largest linguistic group of India?
What is the significance of age-structure?
Why have many European countries have deficit males?
Why is sex ratio in some European countries recorded favourable to females? Give one reason.
Study the given graph carefully and answer the following question:
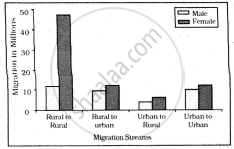
Intra-state Migration by place of Last Residence Indicating Migration Streams India, 2011
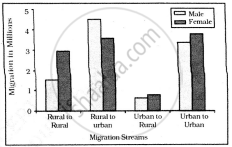
Inter-state Migration by Place of Last Residence Indicating Migration Streams India, 2011
Which stream of migration shows the lowest trend in interstate migration?
Which type of population pyramid shows a bell shape?
A country having pyramid of population that has a wide base and sharply tapered top is characterised by which of the following?
Draw neat, labelled diagram:
Stationary pyramids
