Advertisements
Online Mock Tests
Chapters

Advertisements
Solutions for Chapter 1: Population : Part - 1
Below listed, you can find solutions for Chapter 1 of Maharashtra State Board Balbharati for Geography [English] Standard 12 Maharashtra State Board.
Balbharati solutions for Geography [English] Standard 12 Maharashtra State Board 1 Population : Part - 1 Intext Questions [Pages 1 - 11]
Give it a try.
The table shows the 10 most populated countries in the world in 2018 with their areas. Calculate their population densities and complete the table.
| Rank | Country | Population in Crores (2018) | Approx. Area (in lakh sq. km.) | Population Density (persons/sq. km.) |
|---|---|---|---|---|
| 1 | China | 142.8 | 96.0 | |
| 2 | India | 135.3 | 32.9 | |
| 3 | United States of America (USA) | 32.7 | 95.3 | |
| 4 | Indonesia | 26.8 | 19.1 | |
| 5 | Pakistan | 21.2 | 8.9 | |
| 6 | Brazil | 20.9 | 85.2 | |
| 7 | Nigeria | 19.6 | 9.2 | |
| 8 | Bangladesh | 16.1 | 1.5 | |
| 9 | Russia | 14.6 | 171.0 | |
| 10 | Mexico | 12.6 | 19.7 |
Make friends with maps!
Look at the map in the given Fig. Compare it with the physical map of the world given. Try to understand the impact of physical factors on population distribution. Complete the table accordingly. One has been done for you as an example.
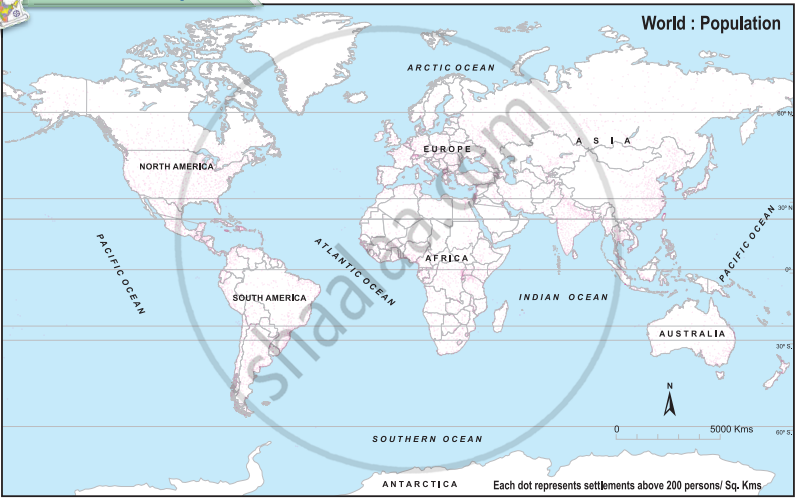
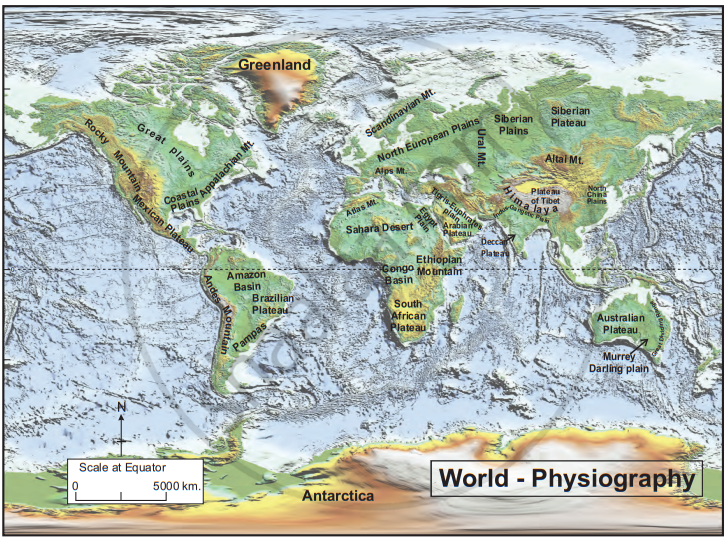
| Continent | Physical Factors Responsible for High Population | Physical Factors Responsible for Less or No Population |
| North America | Coastal areas | Forests, desert, snowcovered land |
Can you tell?
Can you think of the factors besides physiography which affect the distribution of population? Make a list.
Fill in suitable examples of countries or regions in the table. Two examples have been solved for your convenience.
| Physical / Human Factors | High Density | Low Density |
|---|---|---|
| 1) Relief | Flat, lowland e.g. Ganges Plains | Mountainous area e.g. Himalayas |
| 2) Climate | ||
| 3) Availability of Resources | ||
| 4) Economic | Business and financial centre e.g. Tokyo | Low economic growth e.g. Louisiana |
| 5) Social | ||
| 6) Government Policies | ||
| 7) Cultural |
Find out !
Are Eskimos still living in their conventional ways?
What changes can be seen in their lifestyle now?
Use your brain power !
Can lakes be a factor for concentration of population? Find out examples.
Which water bodies are surrounded by dense population in Maharashtra?
Make friends with maps!
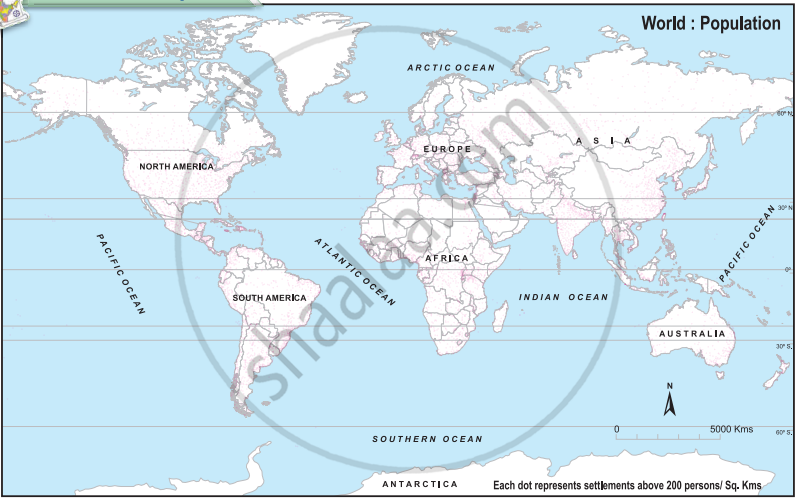
Refer to the map showing rice producing regions of the world in Fig. 1. Relate it with the population map of the world in Fig. 2. Write the conclusions in your own words.
Fig 1:
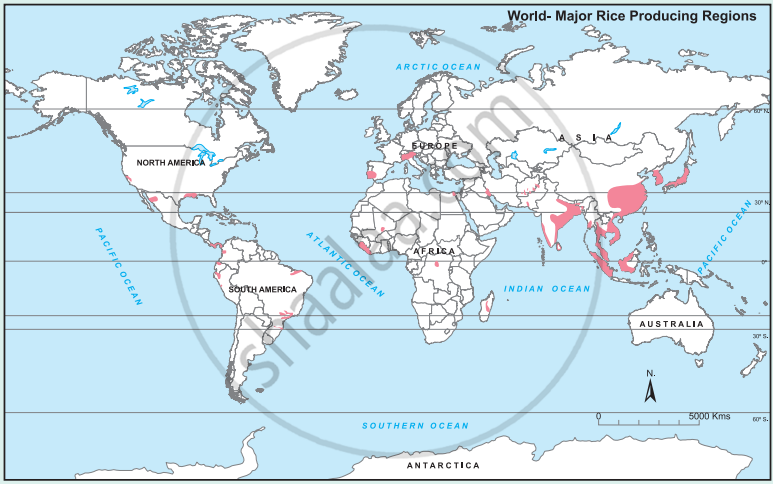
Fig 2:
Give it a try.
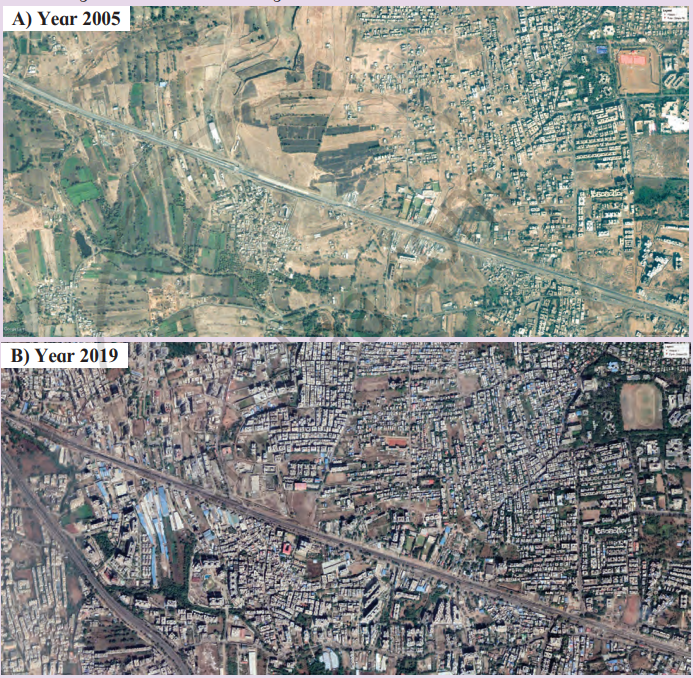
Look at the satellite images given in the given Fig. They show the same area from two different periods.
- What difference do you see?
- What might have caused these changes? Discuss in class.
Let’s recall.
Which policy did the Brazilian government promote with respect to decentralisation?
Try this.
Look at the fig. and answer the questions that follow:
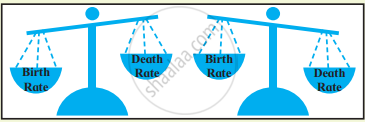
- What does the image show?
- What happens to the population when deaths are more than births?
- What happens to the population when births are more than deaths?
- What happens when both are same? Is it possible?
Give it a try.
In 2019, there were 3,250 births in a city with population of 2,23,000. Therefore:
`"CBR" = (3,250)/(2,23,000) xx 1,000 = 14.57`
So, at that time, there were 14.57 live births for every 1,000 people in the city.
- Can you calculate the death rate in the above example, if the total number of deaths in the city was 2,986 in the same year?
- On the basis of the Birth Rate given earlier and Death Rate calculated by you, what change in population do you observe?
Can you tell?
Observe the table. Arrange data in ascending order for birth rates and death rates respectively.
| Country | Crude BR (2017) | Crude DR (2017) |
| Sweden | 11.5 | 9.1 |
| India | 18.1 | 7.2 |
| Greece | 8.2 | 11.6 |
| China | 12.4 | 7.1 |
| USA | 11.8 | 8.5 |
| Niger | 46.5 | 8.5 |
You know that birth rates and death rates determine the growth or decline in the population. Based on this notion, try to complete the table 1.5, where different combinations of Birth Rates and Death Rates are given. Discuss in the class and complete the table. One has been done for you as an example.
| Sr. No. | Birth Rate | Death Rate | Effect on Population Growth |
|---|---|---|---|
| 1 | High | High | Stable / Low Increase |
| 2 | High | Decreasing | |
| 3 | High | Low | |
| 4 | Decreasing | Low | |
| 5 | Low | Low |
Give it a try.
Look at the graph in thr Fig carefully. Answer the following questions:
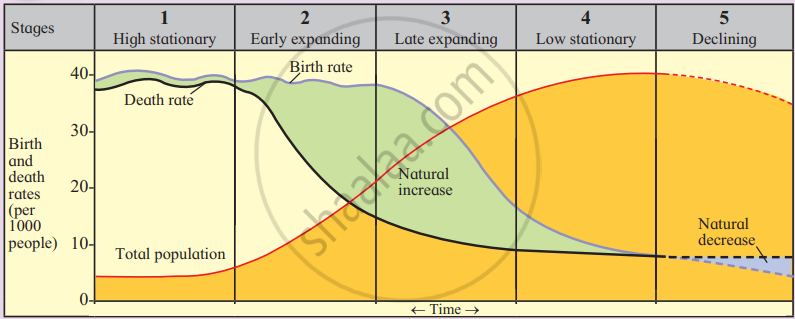
- What do the blue and the black lines show?
- What does the green part in the graph show?
- What does the blue part in the graph show?
- In which stages is the birth rate more than the death rate?
- In which stages is the birth rate same as the death rate?
- In which stage is the death rate more than birth rate?
In which stage do you think India is passing right now?
Can you tell ?
Look at the fig. and answer:
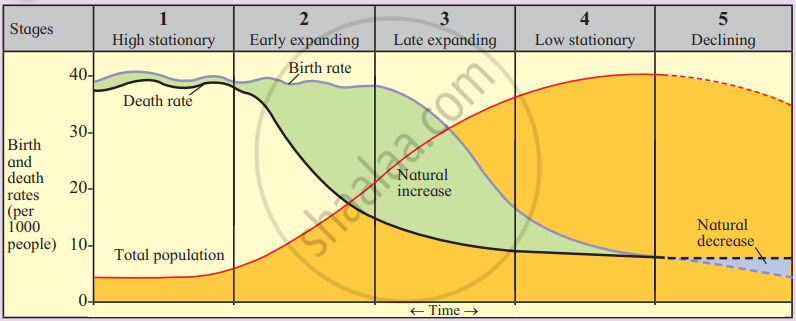
- If the crude birth rate is 7 and the crude death rate is 8 then which stage of demographic transition is the country in?
- If a country has crude death rate of 20 and crude birth rate of 24, then which stage of demographic transition is the country in?
Use your brain power !
Find out in what multiples has population increased in the following timeline and write down your findings.
For example, in the initial phase, the population took 6 centuries (1000 to 1600 A.D.) to double itself. Years (A.D.)

Population of the world approx. (in millions)
Balbharati solutions for Geography [English] Standard 12 Maharashtra State Board 1 Population : Part - 1 Exercise [Page 11]
Identify the correct correlation: A: Assertion; R : Reasoning
Assertion: Areas which have fertile soil have a dense population.
Reasoning: Fertile soils are good for agriculture.
Only A is correct
Only R is correct
Both A and R are correct and R is the correct explanation of A.
Both A and R are correct but R is not the correct explanation of A.
Assertion (A): Population of a region does not change.
Reason (R): Birth rate, death rate and migration affect the population of a region.
Only Assertion is correct.
Only Reason is correct.
Both Assertion and Reason correct and Reason is correct explanation of Assertion.
Both Assertion and Reason correct but Reason is not the correct explanation of Assertion.
A: In stage 2, the death rate reduces but the birth rate is constant.
R: The population increases rapidly in stage 2.
Only A is correct
Only R is correct
Both A and R are correct and R is the correct explanation of A.
Both A and R are correct but R is not the correct explanation of A.
Write a short note on :
Impact of relief on population distribution.
Write a short note on the correlation between birth rates and death rates.
Write a short note on :
Stage 3 of Demographic Transition theory.
Give geographical reason
India is passing through stage 3 of demographic transition.
Give a geographical reason:
Population distribution is uneven.
Give a geographical reason:
Population increases because of transportation facilities.
Give a geographical reason:
Secondary and tertiary activities increase in the third stage of demographic transition.
Give a geographical reason:
Population may increase though birth rates are low.
Give a geographical reason:
Population density is a function of the population and area of a region.
Answer in detail :
Explain the physical factors affecting the distribution of the population.
Answer in detail:
In the first and fifth stages of the demographic transition, population growth is almost nil. What is the difference between the two stages then?
Discuss the problems faced by countries in stage 4 and stage 5.
Draw a neat, labelled diagram:
Demographic Transition Theory
On an outline map of the world, show the following with an index:
- Highly populated region in Australia.
- Sparsely populated region in India.
- Any 2 countries in stage 5 of the Demographic Transition Theory.
- Any 2 countries in stage 2 of the Demographic Transition Theory.
Solutions for 1: Population : Part - 1
Balbharati solutions for Geography [English] Standard 12 Maharashtra State Board chapter 1 - Population : Part - 1
Shaalaa.com has the Maharashtra State Board Mathematics Geography [English] Standard 12 Maharashtra State Board Maharashtra State Board solutions in a manner that help students grasp basic concepts better and faster. The detailed, step-by-step solutions will help you understand the concepts better and clarify any confusion. Balbharati solutions for Mathematics Geography [English] Standard 12 Maharashtra State Board Maharashtra State Board 1 (Population : Part - 1) include all questions with answers and detailed explanations. This will clear students' doubts about questions and improve their application skills while preparing for board exams.
Further, we at Shaalaa.com provide such solutions so students can prepare for written exams. Balbharati textbook solutions can be a core help for self-study and provide excellent self-help guidance for students.
Concepts covered in Geography [English] Standard 12 Maharashtra State Board chapter 1 Population : Part - 1 are Overview of Population : Part - 1, Geographical Factors Affecting Population Distribution - Physical Factors, Geographical Factors Affecting Population Distribution - Human Factors, Components of Population Change, Distribution of Population in India, Factors Influencing the Distribution of the Population, Trends in Population Growth, Population Distribution in the World.
Using Balbharati Geography [English] Standard 12 Maharashtra State Board solutions Population : Part - 1 exercise by students is an easy way to prepare for the exams, as they involve solutions arranged chapter-wise and also page-wise. The questions involved in Balbharati Solutions are essential questions that can be asked in the final exam. Maximum Maharashtra State Board Geography [English] Standard 12 Maharashtra State Board students prefer Balbharati Textbook Solutions to score more in exams.
Get the free view of Chapter 1, Population : Part - 1 Geography [English] Standard 12 Maharashtra State Board additional questions for Mathematics Geography [English] Standard 12 Maharashtra State Board Maharashtra State Board, and you can use Shaalaa.com to keep it handy for your exam preparation.
