Advertisements
Advertisements
Question
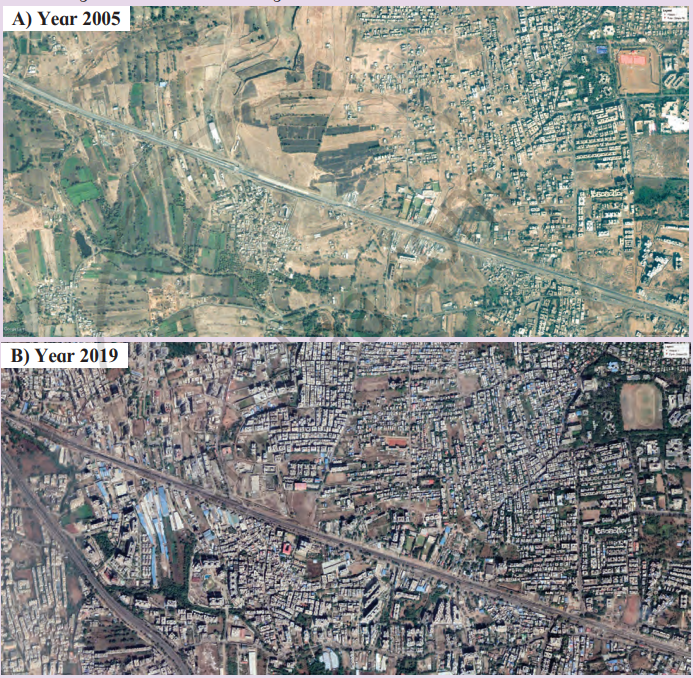
Look at the satellite images given in the given Fig. They show the same area from two different periods.
- What difference do you see?
- What might have caused these changes? Discuss in class.
Long Answer
Advertisements
Solution
In the 2005 satellite image, the area has more open land, agricultural fields and fewer buildings. In the 2019 image, the same area shows a large increase in houses, roads and other built-up structures.
Possible causes of these changes:
- Increase in population.
- Rapid urbanisation around Pune.
- Expansion of residential areas.
- Development of roads and transport facilities.
- Growth of industries and commercial activities.
- Conversion of agricultural land into built-up land.
Thus, the images show that population growth and urban development have increased the built-up area and reduced open and agricultural land.
shaalaa.com
Is there an error in this question or solution?
