Advertisements
Advertisements
Question
Look at the graph in thr Fig carefully. Answer the following questions:
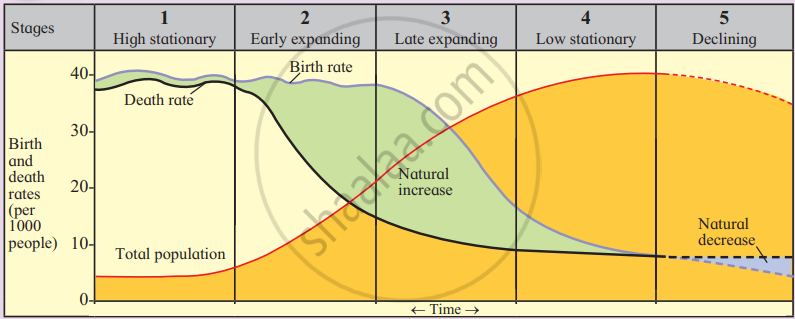
- What do the blue and the black lines show?
- What does the green part in the graph show?
- What does the blue part in the graph show?
- In which stages is the birth rate more than the death rate?
- In which stages is the birth rate same as the death rate?
- In which stage is the death rate more than birth rate?
Long Answer
Advertisements
Solution
- The blue line shows the birth rate and the black line shows the death rate.
- The green shaded part shows natural increase in population, where the birth rate is higher than the death rate.
- The blue shaded part shows natural decrease in population, where the death rate becomes higher than the birth rate.
- The birth rate is more than the death rate in Stages 2, 3 and 4.
- The birth rate and death rate are nearly the same in Stage 1.
- The death rate is more than the birth rate in Stage 5.
shaalaa.com
Is there an error in this question or solution?
