Advertisements
Advertisements
Question
Mr. Mirza’s monthly income is Rs. 7,200. He spends Rs. 1,800 on rent, Rs. 2,700 on food, Rs. 900 on the education of his children; Rs. 1,200 on Other things and saves the rest.
Draw a pie-chart to represent it.
Advertisements
Solution
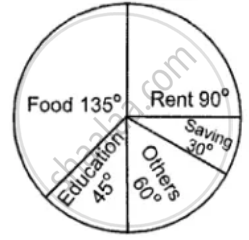
| Name of items | Expenditure/Saving in Rupees | Central angle |
| Rent | 1800 | `1800/7200 xx 360^circ = 90^circ` |
| food | 2700 | `2700/7200 xx 360^circ = 135^circ` |
| Education | 900 | `900/7200 xx 360^circ = 45^circ` |
| Others | 1200 | `1200/7200 xx 360^circ = 60^circ` |
| Saving | 600 | `600/7200 xx 360^circ = 30^circ` |
| Total | 7200 | `360^circ` |
APPEARS IN
RELATED QUESTIONS
A random survey of the number of children of various age groups playing in a park was found as follows:
| Age (in years) | Number of children |
| 1 - 2 | 5 |
| 2 - 3 | 3 |
| 3 - 5 | 6 |
| 5 - 7 | 12 |
| 7 - 10 | 9 |
| 10 - 15 | 10 |
| 15 - 17 | 4 |
Draw a histogram to represent the data above.
Given below (Fig. below) is the bar graph indicating the marks obtained out of 50 in mathematics paper by 100 students. Read the bar graph and answer the following questions:

(i) It is decided to distribute work books on mathematics to the students obtaining less than 20 marks, giving one workbook to each of such students. If a work book
costs Rs 5, what sum is required to buy the work books?
(ii) Every student belonging to the highest mark group is entitled to get a prize of Rs. 10. How much amount of money is required for distributing the prize money?
(iii) Every student belonging to the lowest mark—group has to solve 5 problems per day. How many problems, in all, will be solved by the students of this group per day?
(iv) State whether true or false.
a. 17% students have obtained marks ranging from 40 to 49.
b. 59 students have obtained marks ranging from 10 to 29.
(v) What is the number of students getting less than 20 marks?
(vi) What is the number of students getting more than 29 marks?
(vii) What is the number of students getting marks between 9 and 40?
(viii) What is the number of students belonging to the highest mark group?
(ix) What is the number of students obtaining more than 19 marks?
The bar graph shown in Fig 23.16 represents the circulation of newspapers in 10 languages. Study the bar graph and answer the following questions:

(i) What is the total number of newspapers published in Hindi, English, Urdu, Punjabi and Bengali?
(ii) What percent is the number of news papers published in Hindi of the total number of newspapers?
(iii) Find the excess of the number of newspapers published in English over those published in Urdu.
(iv) Name two pairs of languages which publish the same number of newspapers.
(v) State the language in which the smallest number of newspapers are published.
(vi) State the language in which the largest number of newspapers are published.
(vii) State the language in which the number of newspapers published is between 2500 and 3500.
(viii) State whether true or false:
a. The number of newspapers published in Malayalam and Marathi together is less than those published in English.
b. The number of newspapers published in Telugu is more than those published in Tamil.
Read the bar graph given in Fig. 23.21 and answer the following questions:
(i) What is the information given by the bar graph?
(ii) What is the number of families having 6 members?
(iii) How many members per family are there in the maximum number of families? Also tell the number of such families.
(iv) What are the number of members per family for which the number of families are equal? Also, tell the number of such families?
The following data gives the production of foodgrains (in thousand tonnes) for some years:
| Year | 1995 | 1996 | 1997 | 1998 | 1999 | 2000 |
| Production (in thousand tonnes |
120 | 150 | 140 | 180 | 170 | 190 |
Represent the above with the help of a bar graph.
The income and expenditure for 5 years of a family is given in the following data:
| Years | 1995-96 | 1996-97 | 1997-98 | 1998-99 | 1999-2000 |
| Income (Rs. inthousands) |
100 | 140 | 150 | 170 | 210 |
| Expenditure (Rs. in thousands) |
80 | 130 | 145 | 160 | 190 |
Represent the above data by a gar graph.
The following data gives the value (in crores of rupees) of the Indian export of cotton textiles for different years:
| Years | 1982 | 1983-1984 | 1984-1985 | 1985-1986 | 1986-1987 |
| Value of Export of Cotton Textiles (in crores of rupees) |
300 | 325 | 475 | 450 | 550 |
Represent the above data with the help of a bar graph. Indicate with the help of a bar graph the year in which the rate of increase in exports is maximum over the preceding year.
The production of oil (in lakh tonnes) in some of the refineries in India during 1982 was given below:
| Refinery: | Barauni | Koyali | Mathura | Mumbai | Florida |
| Production of oil (in lakh tonnes) |
30 | 70 | 40 | 45 | 25 |
Construct a bar graph to represent the above data so that the bars are drawn horizontally.
A histogram is a pictorial representation of the grouped data in which class intervals and frequency are respectively taken along
The following table shows the market position of different brands of tea-leaves.
| Brand | A | B | C | D | others |
| % of Buyers | 35 | 20 | 20 | 15 | 10 |
Draw it-pie-chart to represent the above information.
