Advertisements
Advertisements
Question
A random survey of the number of children of various age groups playing in a park was found as follows:
| Age (in years) | Number of children |
| 1 - 2 | 5 |
| 2 - 3 | 3 |
| 3 - 5 | 6 |
| 5 - 7 | 12 |
| 7 - 10 | 9 |
| 10 - 15 | 10 |
| 15 - 17 | 4 |
Draw a histogram to represent the data above.
Advertisements
Solution
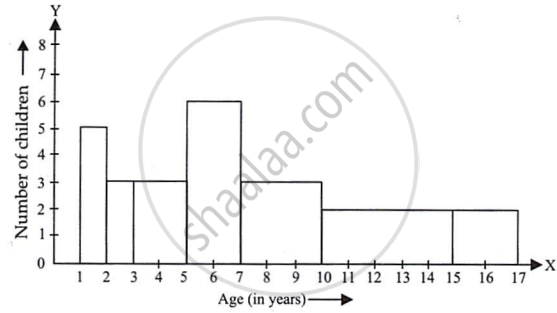
Here, it can be observed that the data has class intervals of varying width. The proportion of children per 1 year interval can be calculated as follows.
| Age (in years) | Frequency (Number of children) | Width of the class | Length of the rectangle |
| 1 - 2 | 5 | 1 | `(5 xx 1)/1` = 5 |
| 2 - 3 | 3 | 1 | `(3 xx 1)/1` = 3 |
| 3 - 5 | 6 | 2 | `(6 xx 1)/2` = 3 |
| 5 - 7 | 12 | 2 | `(12 xx 1)/2` = 6 |
| 7 - 10 | 9 | 3 | `(9 xx 1)/3` = 6 |
| 10 - 15 | 10 | 5 | `(10 xx 1)/5` = 2 |
| 15 - 17 | 4 | 2 | `(4 xx 1)/2` = 2 |
Taking the age of children on the x-axis and the proportion of children per 1 year interval on the y-axis, the histogram can be drawn as follows:
APPEARS IN
RELATED QUESTIONS
The length of 40 leaves of a plant are measured correct to one millimetre, and the obtained data is represented in the following table:-
| Length (in mm) | Number of leaves |
| 118 - 126 | 3 |
| 127 - 135 | 5 |
| 136 - 144 | 9 |
| 145 - 153 | 12 |
| 154 - 162 | 5 |
| 163 - 171 | 4 |
| 172 - 180 | 2 |
- Draw a histogram to represent the given data. [Hint: First make the class intervals continuous]
- Is there any other suitable graphical representation for the same data?
- Is it correct to conclude that the maximum number of leaves are 153 mm long? Why?
The bar graph shown in Fig 23.16 represents the circulation of newspapers in 10 languages. Study the bar graph and answer the following questions:
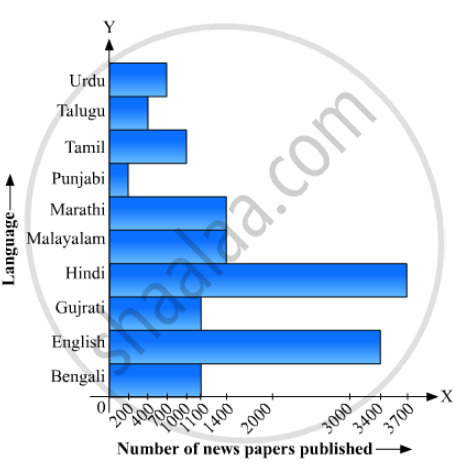
(i) What is the total number of newspapers published in Hindi, English, Urdu, Punjabi and Bengali?
(ii) What percent is the number of news papers published in Hindi of the total number of newspapers?
(iii) Find the excess of the number of newspapers published in English over those published in Urdu.
(iv) Name two pairs of languages which publish the same number of newspapers.
(v) State the language in which the smallest number of newspapers are published.
(vi) State the language in which the largest number of newspapers are published.
(vii) State the language in which the number of newspapers published is between 2500 and 3500.
(viii) State whether true or false:
a. The number of newspapers published in Malayalam and Marathi together is less than those published in English.
b. The number of newspapers published in Telugu is more than those published in Tamil.
The following bar graph shows the results of an annual examination in a secondary school. Read the bar graph and choose the correct alternative in each of the following:
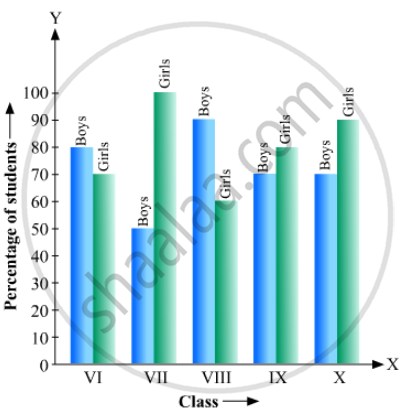
(i) The pair of classes in which the results of boys and girls are inversely proportional are:
(a) VI, VIII (b) VI, IX (c) VIII, IX (d) VIII, X
(ii) The class having the lowest failure rate of girls is
(a) VII (b) X (c) IX (d) VIII
(iii)The class having the lowest pass rate of students is
(a) VI (b) VII (c) VIII (d) IX
The population of Delhi State in different census years is as given below:
| Census year | 1961 | 1971 | 1981 | 1991 | 2001 |
| Population in Lakhs | 30 | 55 | 70 | 110 | 150 |
The production of saleable steel in some of the steel plants our country during 1999 is given below:
| Plant | Bhilai | Durgapur | Rourkela | Bokaro |
| Production (In thousand tonnes) |
160 | 80 | 200 | 150 |
Construct a bar graph to represent the above data on a graph paper by using the scale 1 big divisions = 20 thousand tonnes.
The following data gives the amount of loans (in crores of rupees) disbursed by a bank during some years:
| Year | 1992 | 1993 | 1994 | 1995 | 1996 |
| Loan (in crores of rupees) |
28 | 33 | 55 | 55 | 80 |
(i) Represent the above data with the help of a bar graph.
(ii) With the help of the bar graph, indicate the year in which amount of loan is not increased over that of the preceding year.
The following data gives the production of foodgrains (in thousand tonnes) for some years:
| Year | 1995 | 1996 | 1997 | 1998 | 1999 | 2000 |
| Production (in thousand tonnes |
120 | 150 | 140 | 180 | 170 | 190 |
Represent the above with the help of a bar graph.
In the 'less than' type of ogive the cumulative frequency is plotted against
The following tables show the mode of transport used by boys and girls for going to the same school.
| Bus | Bicycle | Walking | Other sources | |
|
Number of boys |
80 | 60 | 20 | 85 |
|
Number of girls |
90 | 75 | 35 | 60 |
Draw a double bar graph representing the above data.
The lengths of 62 leaves of a plant are measured in millimetres and the data is represented in the following table:
| Length (in mm) | Number of leaves |
| 118 – 126 | 8 |
| 127 – 135 | 10 |
| 136 – 144 | 12 |
| 145 – 153 | 17 |
| 154 – 162 | 7 |
| 163 – 171 | 5 |
| 172 – 180 | 3 |
Draw a histogram to represent the data above.
