Advertisements
Advertisements
प्रश्न
Mr. Mirza’s monthly income is Rs. 7,200. He spends Rs. 1,800 on rent, Rs. 2,700 on food, Rs. 900 on the education of his children; Rs. 1,200 on Other things and saves the rest.
Draw a pie-chart to represent it.
Advertisements
उत्तर
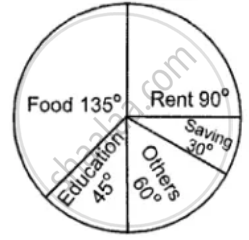
| Name of items | Expenditure/Saving in Rupees | Central angle |
| Rent | 1800 | `1800/7200 xx 360^circ = 90^circ` |
| food | 2700 | `2700/7200 xx 360^circ = 135^circ` |
| Education | 900 | `900/7200 xx 360^circ = 45^circ` |
| Others | 1200 | `1200/7200 xx 360^circ = 60^circ` |
| Saving | 600 | `600/7200 xx 360^circ = 30^circ` |
| Total | 7200 | `360^circ` |
APPEARS IN
संबंधित प्रश्न
100 surnames were randomly picked up from a local telephone directory and a frequency distribution of the number of letters in the English alphabet in the surnames was found as follows:
| Number of letters | Number of surnames |
| 1 - 4 | 6 |
| 4 - 6 | 30 |
| 6 - 8 | 44 |
| 8 - 12 | 16 |
| 12 - 20 | 4 |
- Draw a histogram to depict the given information.
- Write the class interval in which the maximum number of surnames lie.
The following table shows the number of Maruti cars sold by five dealers in a particular month:
| Dealer: | Saya | Bagga Links | D.D. Motors | Bhasin Motors | Competent |
| Cars sold: | 60 | 40 | 20 | 15 | 10 |
Represent the above information by a pictograph.
The investment (in ten crores of rupees) of Life Insurance Corporation of India in different sectors are given below:
| Sectors | Investment (in ten crores of rupees) |
| Central Government Securities State Government Securities Securities guaranteed by the Government Private Sectors Socially oriented sectors (Plans) Socially oriented sectors (Non-Plan) |
45 11 23 18 46 11 |
Represent the above data with the help of bar graph.
The distribution of heights (in cm) of 96 children is given below. Construct a histogram and a frequency polygon on the same axes.
| Height (in cm): | 124 to 128 |
128 to 132 |
132 to 136 |
136 to 140 |
140 to 144 |
144 to 148 |
148 to 152 |
152 to 156 |
156 to 160 |
160 to 164 |
| No. of Children: | 5 | 8 | 17 | 24 | 16 | 12 | 6 | 4 | 3 | 1 |
In a histogram, each class rectangle is constructed with base as
Expenditure on Education of a country during a five year period (2002-2006), in crores of rupees, is given below:
| Elementary education | 240 |
| Secondary Education | 120 |
| University Education | 190 |
| Teacher’s Training | 20 |
| Social Education | 10 |
| Other Educational Programmes | 115 |
| Cultural programmes | 25 |
| Technical Education | 125 |
Represent the information above by a bar graph.
Draw a histogram of the following distribution:
| Heights (in cm) | Number of students |
| 150 – 153 | 7 |
| 153 – 156 | 8 |
| 156 – 159 | 14 |
| 159 – 162 | 10 |
| 162 – 165 | 6 |
| 165 – 168 | 5 |
Draw a histogram to represent the following grouped frequency distribution:
| Ages (in years) | Number of teachers |
| 20 – 24 | 10 |
| 25 – 29 | 28 |
| 30 – 34 | 32 |
| 35 – 39 | 48 |
| 40 – 44 | 50 |
| 45 – 49 | 35 |
| 50 – 54 | 12 |
Following table shows a frequency distribution for the speed of cars passing through at a particular spot on a high way:
| Class interval (km/h) | Frequency |
| 30 – 40 | 3 |
| 40 – 50 | 6 |
| 50 – 60 | 25 |
| 60 – 70 | 65 |
| 70 – 80 | 50 |
| 80 – 90 | 28 |
| 90 – 100 | 14 |
Draw a histogram and frequency polygon representing the data above.
Following table shows a frequency distribution for the speed of cars passing through at a particular spot on a high way:
| Class interval (km/h) | Frequency |
| 30 – 40 | 3 |
| 40 – 50 | 6 |
| 50 – 60 | 25 |
| 60 – 70 | 65 |
| 70 – 80 | 50 |
| 80 – 90 | 28 |
| 90 – 100 | 14 |
Draw the frequency polygon representing the above data without drawing the histogram.
