Advertisements
Advertisements
Question
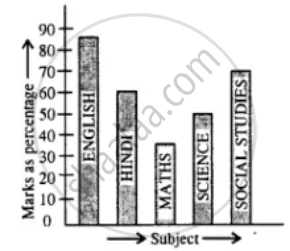
The percentage of marks obtained, in different subjects by Ashok Sharma (in an examination) is given below. Draw a bar graph to represent it.
| English | Hindi | Maths | Science | Social Studies |
| 85 | 60 | 35 | 50 | 70 |
Advertisements
Solution
APPEARS IN
RELATED QUESTIONS
A survey conducted by an organisation for the cause of illness and death among the women between the ages 15 - 44 (in years) worldwide, found the following figures (in %):-
| S.No. | Causes | Female fatality rate (%) |
| 1. | Reproductive health conditions | 31.8 |
| 2. | Neuropsychiatric conditions | 25.4 |
| 3. | Injuries | 12.4 |
| 4. | Cardiovascular conditions | 4.3 |
| 5. | Respiratory conditions | 4.1 |
| 6. | Other causes | 22.0 |
- Represent the information given above graphically.
- Which condition is the major cause of women’s ill health and death worldwide?
- Try to find out, with the help of your teacher, any two factors which play a major role in the cause in (ii) above being the major cause.
Read the bar graph shown in Fig. 23.10 and answer the following questions
(i) What is the information given by the bar graph?

(ii) What was the number of commercial banks in 1977?
(iii) What is the ratio of the number of commercial banks in 1969 to that in 1980?
(iv) State whether true or false:
The number of commercial banks in 1983 is less than double the number of commercial banks in 1969.
Read the following bar graph (Fig. 23.12) and answer the following questions:
(i) What is the information given by the bar graph?
(ii) State each of the following whether true or false.
a. The number of government companies in 1957 is that of 1982 is 1 :9.
b. The number of government companies have decreased over the year 1957 to 1983.

Read the bar graph given in Fig. below and answer the following questions:

(i) What information does it give?
(ii) In which part the expenditure on education is maximum in 1980?
(iii) In which part the expenditure has gone up from 1980 to 1990?
(iv) In which part the gap between 1980 and 1990 is maximum?
The population of Delhi State in different census years is as given below:
| Census year | 1961 | 1971 | 1981 | 1991 | 2001 |
| Population in Lakhs | 30 | 55 | 70 | 110 | 150 |
Draw a histogram for the daily earnings of 30 drug stores in the following table:
| Daily earning (in Rs): |
450-500 | 500-550 | 550-600 | 600-650 | 650-700 |
| Number of Stores: | 16 | 10 | 7 | 3 | 1 |
In a histogram, each class rectangle is constructed with base as
Draw frequency polygons for each of the following frequency distribution:
(a) using histogram
(b) without using histogram
|
C.I |
5 -15 | 15 -25 | 25 -35 | 35 - 45 | 45-55 | 55-65 |
| ƒ | 8 | 16 | 18 | 14 | 8 | 2 |
The following tables show the mode of transport used by boys and girls for going to the same school.
| Bus | Bicycle | Walking | Other sources | |
|
Number of boys |
80 | 60 | 20 | 85 |
|
Number of girls |
90 | 75 | 35 | 60 |
Draw a double bar graph representing the above data.
The lengths of 62 leaves of a plant are measured in millimetres and the data is represented in the following table:
| Length (in mm) | Number of leaves |
| 118 – 126 | 8 |
| 127 – 135 | 10 |
| 136 – 144 | 12 |
| 145 – 153 | 17 |
| 154 – 162 | 7 |
| 163 – 171 | 5 |
| 172 – 180 | 3 |
Draw a histogram to represent the data above.
