Advertisements
Advertisements
Question
Draw a p-V diagram of the reversible process.
Advertisements
Solution
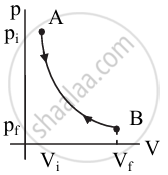
p-V diagram of reversible process
RELATED QUESTIONS
Explain why The climate of a harbour town is more temperate than that of a town in a desert at the same latitude.
Answer in brief.
Why should a Carnot cycle have two isothermal two adiabatic processes?
An ideal gas is taken through an isothermal process. If it does 2000 J of work on its environment, how much heat is added to it?
What is a thermodynamic process?
Explain graphically (i) positive work with varying pressure, (ii) negative work with varying pressure, and (iii) positive work at constant pressure.
Explain the thermodynamics of the isochoric process.
The V-T diagram of an ideal gas which goes through a reversible cycle A→B→C→D is shown below. (Processes D→A and B→C are adiabatic)

The corresponding PV diagram for the process is (all figures are schematic)
Give an expression for work done in an isothermal process.
Apply first law for an isobaric process.
Give the equation of state for an adiabatic process.
Draw the PV diagram for the isothermal process.
Draw the PV diagram for the adiabatic process.
What is a cyclic process?
Explain the isobaric process and derive the work done in this process.
In an adiabatic expansion of the air, the volume is increased by 4%, what is the percentage change in pressure? (For air γ = 1.4)
Consider the following cyclic process consist of isotherm, isochoric and isobar which is given in the figure.

Draw the same cyclic process qualitatively in the V-T diagram where T is taken along the x-direction and V is taken along the y-direction. Analyze the nature of heat exchange in each process.
An ideal gas is taken in a cyclic process as shown in the figure. Calculate
- work done by the gas
- work done on the gas
- Net work done in the process

For a given ideal gas 6 × 10⁵ J heat energy is supplied and the volume of gas is increased from 4 m3 to 6 m3 at atmospheric pressure. Calculate
- the work done by the gas
- change in internal energy of the gas
- graph this process in PV and TV diagram
Among the amount of heat absorbed and the amount of work done by a system, ______
An ideal gas is made to go from a state A to stale B in the given two different ways (see figure) (i) an isobaric and then an isochoric process and (ii) an isochoric and then an isobaric process. The work done by gas in the two processes are W1 and W2 respectively. Then,

Two identical samples of a gas are allowed to expand (i) isothermally (ii) adiabatically. Work done is ____________.
In an isothermal process, the volume of an ideal gas is halved. One can say that ____________.
An ideal gas is compressed to half its initial volume by means of several processes. Which of the process results in the maximum work done on the gas?
Ideal gas for which 'ϒ' = 1.5 is suddenly compressed to `1/4`th of its initial volume. The ratio of 4 the final pressure to the initial pressure is ______.
`(ϒ = "C"_"p"/"C"_"v")`
Consider P-V diagram for an ideal gas shown in figure.
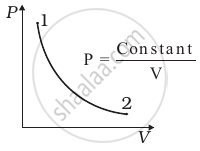
Out of the following diagrams (figure), which represents the T-P diagram?
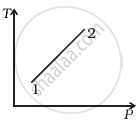 (i) |
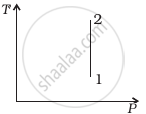 (ii) |
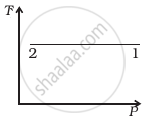 (iii) |
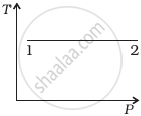 (iv) |
Explain how can a gas be expanded at constant temperature.
In a cyclic process, if ΔU = internal energy, W = work done, Q = Heat supplied then ______.
