Advertisements
Advertisements
Question
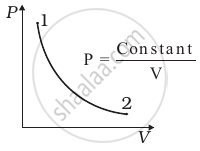
Consider P-V diagram for an ideal gas shown in figure.
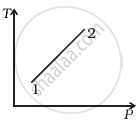
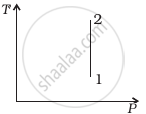
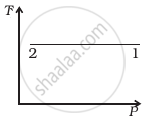
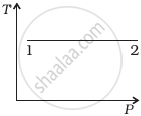
Out of the following diagrams (figure), which represents the T-P diagram?
 (i) |
 (ii) |
 (iii) |
 (iv) |
Options
(iv)
(ii)
(iii)
(i)
Advertisements
Solution
Explanation:
According to the P-V diagram provided in the question, P increases as V decreases at a constant temperature. So, it is Boyle's law. So, the temperature will remain constant in the TP graph and pressure will be higher at stage 1 than at stage 2.
APPEARS IN
RELATED QUESTIONS
Explain why The climate of a harbour town is more temperate than that of a town in a desert at the same latitude.
An ideal gas of volume 2 L is adiabatically compressed to (1/10)th of its initial volume. Its initial pressure is 1.01 x 10⁵ Pa, calculate the final pressure. (Given 𝛾 = 1.4)
Explain work done during a thermodynamic process.
Explain the thermodynamics of the isochoric process.
When food is cooked in a vessel by keeping the lid closed, after some time the steam pushes the lid outward. By considering the steam as a thermodynamic system, then in the cooking process
Apply first law for an isobaric process.
Give the equation of state for an adiabatic process.
Draw the PV diagram for the isothermal process.
Can the given heat energy be completely converted to work in a cyclic process? If not, when can the heat can completely converted to work?
What are the limitations of the first law of thermodynamics?
For a given ideal gas 6 × 10⁵ J heat energy is supplied and the volume of gas is increased from 4 m3 to 6 m3 at atmospheric pressure. Calculate
- the work done by the gas
- change in internal energy of the gas
- graph this process in PV and TV diagram
A thermodynamic system undergoes cyclic process ABCDA as shown in the figure. The work done by the system is ______

An ideal gas is expanded isothermally from volume V1 to volume V2 and then compressed adiabatically to original volume V1. If the initial pressure is P1, the final pressure is P3 and net work done is W, then ____________.
An ideal gas is made to go from a state A to stale B in the given two different ways (see figure) (i) an isobaric and then an isochoric process and (ii) an isochoric and then an isobaric process. The work done by gas in the two processes are W1 and W2 respectively. Then,

Two identical samples of a gas are allowed to expand (i) isothermally (ii) adiabatically. Work done is ____________.
We consider a thermodynamic system. If `Delta"U"` represents the increase in its internal energy and W the work done by the system, which of the following statements is true?
The work done on the system in changing the state of a gas adiabatically from equilibrium state A to equilibrium state B is 22.4 J. If the gas is taken from state A to B through another process in which the net heat absorbed by the system is 15.5 cal, then the net work done by the system in the latter case is ______.
( l cal = 4.2 J)
Which of the following processes is reversible?
In the figure shown here, the work done in the process ACBA is ______.

