Advertisements
Advertisements
Question
Explain in detail the isochoric process.
Advertisements
Solution
Isochoric process: This is a thermodynamic process in which the volume of the system is kept constant. But pressure, temperature and internal energy continue to be variables.
The pressure-volume graph for an isochoric process is a vertical line parallel to the pressure axis as shown in Figure.

Isochoric process with increased pressure
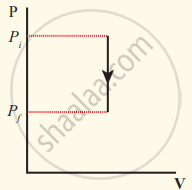
Isochoric process with decreased pressure

Isochoric process
P = `((μ"R")/"V")"T"` ...............(1)
where `((μ"R")/"V")` = constant
We can infer that the pressure is directly proportional to temperature. This implies that the P-T graph for an isochoric process is a straight line passing through the origin. If gas goes from the state (Pi, Ti) to (Pf, Tf) at constant volume, then the system satisfies the following equation
`"P"_"i"/"T"_"i" = "P"_"f"/"T"_"f"` .....,,,(2)
For an isochoric processes, ∆V = 0 and W = 0. Then the first law becomes
∆U = 0 .................(3)
Implying that the heat supplied is used to increase only the internal energy. As a result the temperature increases and pressure also increases.
Suppose a system loses heat to the surroundings through conducting walls by keeping the volume constant, then its internal energy decreases. As a result the temperature decreases; the pressure also decreases.
APPEARS IN
RELATED QUESTIONS
Explain the cyclic process.
An ideal gas of volume 2 L is adiabatically compressed to (1/10)th of its initial volume. Its initial pressure is 1.01 x 10⁵ Pa, calculate the final pressure. (Given 𝛾 = 1.4)
Explain graphically (i) positive work with varying pressure, (ii) negative work with varying pressure, and (iii) positive work at constant pressure.
Write a note on free expansion.
Explain work done during a thermodynamic process.
Explain the thermodynamics of the isobaric process.
When a cycle tyre suddenly bursts, the air inside the tyre expands. This process is ____________.
Draw the PV diagram for the isochoric process.
Explain in detail an adiabatic process.
For an isothermal expansion of a perfect gas, the value of `(Delta "P")/"P"` is equal to ____________.
