Advertisements
Advertisements
Question
Draw the TP diagram (P-x axis, T-y axis), VT(T-x axis, V-y axis) diagram for
- Isochoric process
- Isothermal process
- Isobaric process
Advertisements
Solution
a. Isobaric process: PV0 = nRT

P(T) = `("nRT")/"V"_0` and T(V) = Multivalued
b. Isothermal process: PV = nRT0

P(T) = Multivalued and T(V) = T0
c. Isobaric process: P0V = nRT
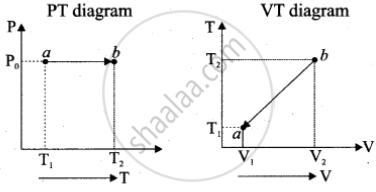
P(T) = P0 and T(V) = `("P"_0"V")/"nR"`
APPEARS IN
RELATED QUESTIONS
Explain work done during a thermodynamic process.
Draw the PV diagram for the isothermal process.
Draw the PV diagram for the adiabatic process.
Can the given heat energy be completely converted to work in a cyclic process? If not, when can the heat can completely converted to work?
Explain in detail an adiabatic process.
In an adiabatic expansion of the air, the volume is increased by 4%, what is the percentage change in pressure? (For air γ = 1.4)
For an isothermal expansion of a perfect gas, the value of `(Delta "P")/"P"` is equal to ____________.
In an isothermal process, the volume of an ideal gas is halved. One can say that ____________.
Assertion: Equal volumes of monatomic and polyatomic gases are adiabatically compressed separately to equal compression ratio `("P"_2/"P"_1)`. Then monatomic gas will have greater final volume.
Reason: Among ideal gases, molecules of a monatomic gas have the smallest number of degrees of freedom.
In the figure shown here, the work done in the process ACBA is ______.

