Advertisements
Advertisements
प्रश्न
Draw the TP diagram (P-x axis, T-y axis), VT(T-x axis, V-y axis) diagram for
- Isochoric process
- Isothermal process
- Isobaric process
Advertisements
उत्तर
a. Isobaric process: PV0 = nRT

P(T) = `("nRT")/"V"_0` and T(V) = Multivalued
b. Isothermal process: PV = nRT0

P(T) = Multivalued and T(V) = T0
c. Isobaric process: P0V = nRT
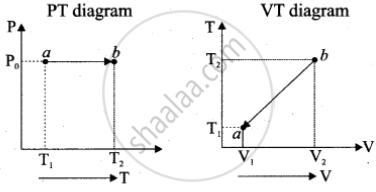
P(T) = P0 and T(V) = `("P"_0"V")/"nR"`
APPEARS IN
संबंधित प्रश्न
Explain why The climate of a harbour town is more temperate than that of a town in a desert at the same latitude.
A thermodynamic system is taken from an original state to an intermediate state by the linear process shown in Figure
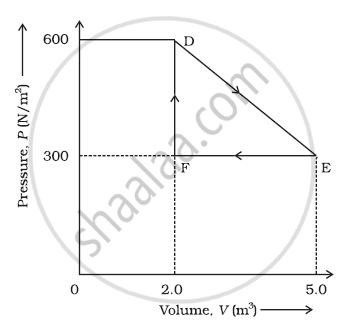
Its volume is then reduced to the original value from E to F by an isobaric process. Calculate the total work done by the gas from D to E to F
Draw a p-V diagram of the irreversible process.
Explain the cyclic process.
When food is cooked in a vessel by keeping the lid closed, after some time the steam pushes the lid outward. By considering the steam as a thermodynamic system, then in the cooking process
Can the given heat energy be completely converted to work in a cyclic process? If not, when can the heat can completely converted to work?
In a petrol engine, (internal combustion engine) air at atmospheric pressure and temperature of 20°C is compressed in the cylinder by the piston to `1/8` of its original volume. Calculate the temperature of the compressed air. (For air γ = 1.4)
One mole of an ideal gas with `gamma` = 1.4 is adiabatically compressed so that its temperature rises from 27° C to 47° C. The change in the internal energy of the gas is (R = 8.3 J/mol.K) ____________.
Which of the following processes is reversible?
In a certain thermodynamical process, the pressure of a gas depends on its volume as kV3. The work done when the temperature changes from 100°C to 300°C will be ______ nR, where n denotes number of moles of a gas.
