Advertisements
Advertisements
प्रश्न
Draw the TP diagram (P-x axis, T-y axis), VT(T-x axis, V-y axis) diagram for
- Isochoric process
- Isothermal process
- Isobaric process
Advertisements
उत्तर
a. Isobaric process: PV0 = nRT

P(T) = `("nRT")/"V"_0` and T(V) = Multivalued
b. Isothermal process: PV = nRT0

P(T) = Multivalued and T(V) = T0
c. Isobaric process: P0V = nRT
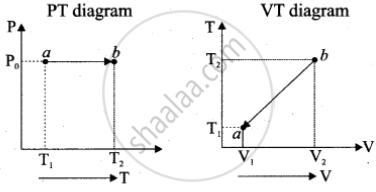
P(T) = P0 and T(V) = `("P"_0"V")/"nR"`
APPEARS IN
संबंधित प्रश्न
Explain why The climate of a harbour town is more temperate than that of a town in a desert at the same latitude.
Answer in brief.
Why should a Carnot cycle have two isothermal two adiabatic processes?
Draw a p-V diagram of the irreversible process.
Draw a p-V diagram showing positive work with varying pressure.
Explain the cyclic process.
What are the limitations of the first law of thermodynamics?
An ideal gas is taken in a cyclic process as shown in the figure. Calculate
- work done by the gas
- work done on the gas
- Net work done in the process

Among the amount of heat absorbed and the amount of work done by a system, ______
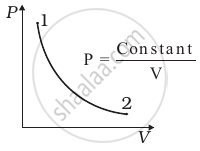
Consider P-V diagram for an ideal gas shown in figure.
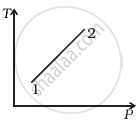
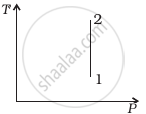
Out of the following diagrams (figure), which represents the T-P diagram?
 (i) |
 (ii) |
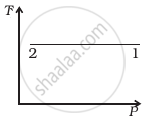 (iii) |
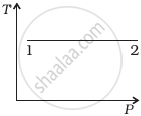 (iv) |
Explain how can a gas be expanded at constant temperature.
