Advertisements
Advertisements
Question
An ideal gas is taken in a cyclic process as shown in the figure. Calculate
- work done by the gas
- work done on the gas
- Net work done in the process

Advertisements
Solution
a. Work done by the gas (along with AB)
W = P × ΔV = 600 × 3 = 1800 J
W = 1.8 kJ
b. Work is done on the gas (along with BC)
W = −P × ΔV = −400 × 3 = −1200 J
W = −1.2 kJ
c. Net work done in the process = Area under the curve AB
= Rectangle area + triangle area
= `("l" xx "b") + (1/2 xx "b" xx "h")`
= `(400 xx 3) + (1/2 xx 3 xx 200)`
= 1200 + 300
= 1500 J
W = 1.5 kJ
APPEARS IN
RELATED QUESTIONS
A thermodynamic system is taken from an original state to an intermediate state by the linear process shown in Figure
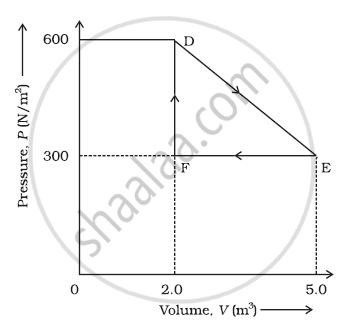
Its volume is then reduced to the original value from E to F by an isobaric process. Calculate the total work done by the gas from D to E to F
Draw a p-V diagram of the irreversible process.
Differentiate between the reversible and irreversible processes.
When a cycle tyre suddenly bursts, the air inside the tyre expands. This process is ____________.
When you exercise in the morning, by considering your body as a thermodynamic system, which of the following is true?
In an isochoric process, we have ____________.
What is a cyclic process?
Derive the work done in an isothermal process.
In an isothermal process, the volume of an ideal gas is halved. One can say that ____________.
In a cyclic process, if ΔU = internal energy, W = work done, Q = Heat supplied then ______.
