Topics
Fractions in Disguise
A Square and A Cube
Part 1
Rational Numbers
- Rational Numbers
- Closure Property of Rational Numbers
- Commutative Property of Rational Numbers
- Associative Property of Rational Numbers
- Distributive Property of Multiplication Over Addition for Rational Numbers
- Identity of Addition and Multiplication of Rational Numbers
- Negative Or Additive Inverse of Rational Numbers
- Concept of Reciprocals or Multiplicative Inverses
- Rational Numbers on a Number Line
- Rational Numbers Between Two Rational Numbers
- Multiples and Common Multiples
Linear Equations in One Variable
- Constants and Variables in Mathematics
- Equation in Mathematics
- Expressions with Variables
- Word Problems on Linear Equations
- Solving Equations Which Have Linear Expressions on One Side and Numbers on the Other Side
- Some Applications Solving Equations Which Have Linear Expressions on One Side and Numbers on the Other Side
- Solving Equations Having the Variable on Both Sides
- Some More Applications on the Basis of Solving Equations Having the Variable on Both Sides
- Reducing Equations to Simpler Form
- Equations Reducible to Linear Equations
Part 2
Power Play
The Baudhayana-Pythagoras Theorem
Proportional Reasoning-2
A Story of Numbers
Understanding Quadrilaterals
- Concept of Curves
- Different Types of Curves - Closed Curve, Open Curve, Simple Curve.
- Basic Concept of Polygons
- Classification of Polygons
- Properties of Quadrilateral
- Sum of Interior Angles of a Polygon
- Sum of Exterior Angles of a Polygon
- Quadrilaterals
- Properties of Trapezium
- Properties of Kite
- Properties of a Parallelogram
- Properties of Rhombus
- Property: The Opposite Sides of a Parallelogram Are of Equal Length.
- Property: The Opposite Angles of a Parallelogram Are of Equal Measure.
- Property: The adjacent angles in a parallelogram are supplementary.
- Property: The diagonals of a parallelogram bisect each other. (at the point of their intersection)
- Property: The diagonals of a rhombus are perpendicular bisectors of one another.
- Property: The Diagonals of a Rectangle Are of Equal Length.
- Properties of Rectangle
- Properties of a Square
- Property: The diagonals of a square are perpendicular bisectors of each other.
Practical Geometry
- Geometric Tool
- Constructing a Quadrilateral When the Lengths of Four Sides and a Diagonal Are Given
- Constructing a Quadrilateral When Two Diagonals and Three Sides Are Given
- Constructing a Quadrilateral When Two Adjacent Sides and Three Angles Are Known
- Constructing a Quadrilateral When Three Sides and Two Included Angles Are Given
- Some Special Cases
Exploring Some Geometric Themes
Quadrilaterals
Data Handling
Squares and Square Roots
- Concept of Square Number
- Properties of Square Numbers
- Some More Interesting Patterns of Square Number
- Finding the Square of a Number
- Concept of Square Roots
- Finding Square Root Through Repeated Subtraction
- Finding Square Root Through Prime Factorisation
- Finding Square Root by Division Method
- Square Root of Decimal Numbers
- Estimating Square Root
Tales by Dots and Lines
Number Play
Cubes and Cube Roots
We Distribute, Yet Things Multiply
Algebra Play
Area
Proportional Reasoning-1
Comparing Quantities
- Ratio
- Increase Or Decrease as Percent
- Concept of Discount
- Estimation in Percentages
- Basic Concepts of Profit and Loss
- Calculation of Interest
- Concept of Compound Interest
- Deducing a Formula for Compound Interest
- Rate Compounded Annually Or Half Yearly (Semi Annually)
- Applications of Compound Interest Formula
Algebraic Expressions and Identities
- Algebraic Expressions
- Terms, Factors and Coefficients of Expression
- Classification of Terms in Algebra
- Addition of Algebraic Expressions
- Subtraction of Algebraic Expressions
- Multiplication of Algebraic Expressions
- Multiplying Monomial by Monomials
- Multiplying a Monomial by a Binomial
- Multiplying a Monomial by a Trinomial
- Multiplying a Binomial by a Binomial
- Multiplying a Binomial by a Trinomial
- Concept of Identity
- Expansion of (a + b)2 = a2 + 2ab + b2
- Expansion of (a - b)2 = a2 - 2ab + b2
- Expansion of (a + b)(a - b) = a2-b2
- Expansion of (x + a)(x + b)
Mensuration
Exponents and Powers
Visualizing Solid Shapes
Direct and Inverse Proportions
Factorization
- Factors and Common Factors
- Factorising Algebraic Expressions
- Factorisation by Taking Out Common Factors
- Factorisation by Regrouping Terms
- Factorisation Using Identities
- Factors of the Form (x + a)(x + b)
- Dividing a Monomial by a Monomial
- Dividing a Polynomial by a Monomial
- Dividing a Polynomial by a Polynomial
- Concept of Find the Error
Introduction to Graphs
Playing with Numbers
- Introduction
- Elements of Bar Graph
- Example 1
- Example 2
- Example 3
- Key Points summary
Introduction
A bar graph represents numerical data through rectangles (bars) of equal width and varying heights.
The height or length of each bar is proportional to the value it represents. Bar graphs can be drawn either horizontally or vertically, depending on the data and presentation preference.
Elements of Bar Graph
| No. | Component | Key Points |
|---|---|---|
| 1 | Axes | • Horizontal axis (X-axis) shows categories/groups • Vertical axis (Y-axis) shows numerical values/frequencies |
| 2 | Bars | • Rectangles of equal width • Equal spacing between adjacent bars • Height proportional to the value represented |
| 3 | Scale | • Chosen to fit data clearly • Shows value of each unit (e.g., 1 cm = 10 plants) |
| 4 | Title | • Clear heading describing what the graph shows |
| 5 | Labels | • Names of categories written below or beside bars |
Example 1
Steps to Draw a Bar Graph (Example: Plants in a Nursery)
Given data:
| Names of plants | Mogara | Jai | Hibiscus | Chrysanthemum |
| Number of plants | 70 | 50 | 45 | 80 |
Steps to draw the bar graph:
-
Write the title at the top: "Types and Number of Plants"
-
Draw two perpendicular lines (X-axis and Y-axis) and mark their point of intersection as O
-
Write the names of plants on the X-axis at equal distances
-
Choose an appropriate scale: 1 cm = 10 plants (since 80 is divisible by 5)
-
Write the scale in the top right-hand corner
-
Mark equal intervals on the Y-axis and label them (0, 10, 20, 30, 40, 50, 60, 70, 80)
-
Draw bars of equal width above each plant name, with heights corresponding to the number of plants

Example 2
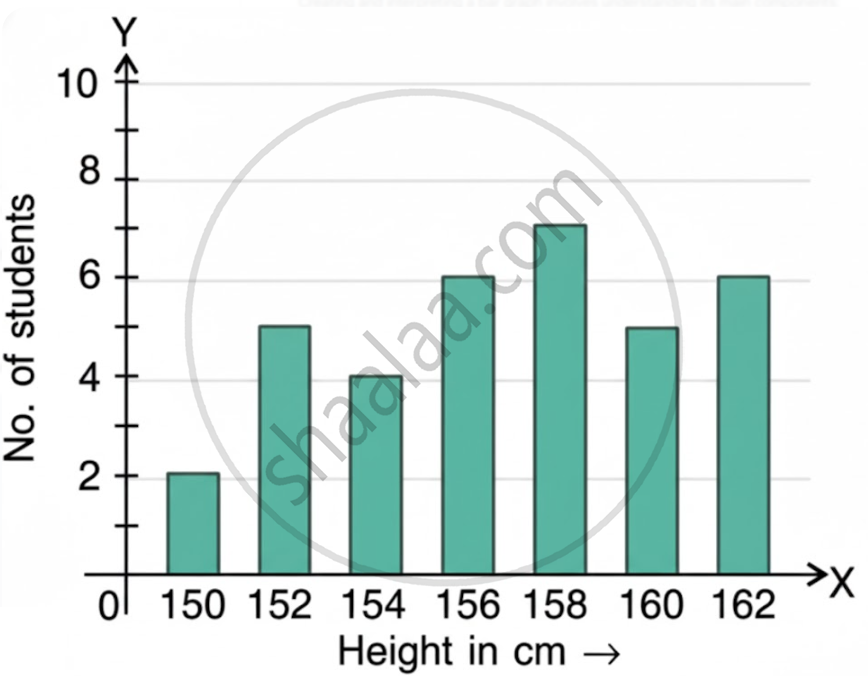
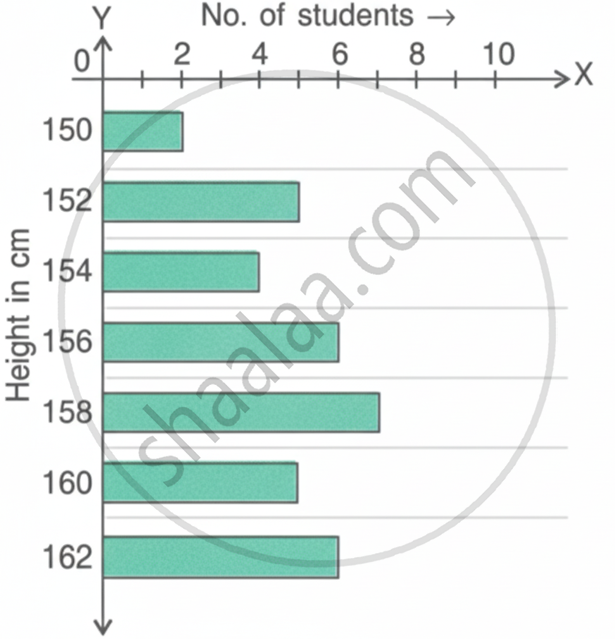
The following table shows the heights of 35 students of a particular class. Draw a
bar graph on the basis of it, and show the number of students of different heights in
the graph.
Given Data:
| No. of students | 2 | 5 | 4 | 6 | 7 | 5 | 6 |
| Height (in cm) | 150 | 152 | 154 | 156 | 158 | 160 | 162 |
Steps to Draw:
-
Draw axes.
-
Mark one axis (X-axis) for heights and the other (Y-axis) for the number of students.
-
Mark equal gaps on the X-axis and label the heights.
-
Choose a suitable scale for the Y-axis.
-
Draw bars above each height, matching the number of students.
(i) Vertical bar graph :
(ii) Horizontal bar graph :
Unless mentioned in the question, we draw a vertical bar graph only.
Example 3
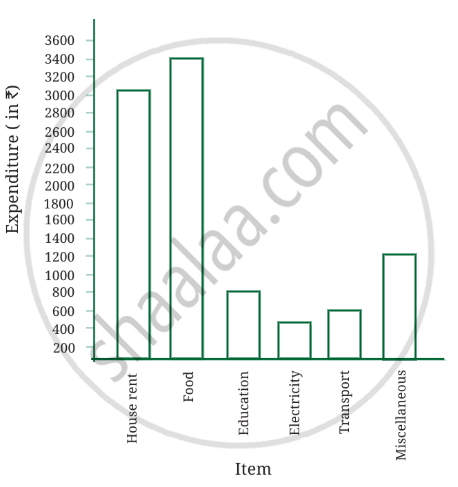
The table shows how much Imran's family spends monthly on different items like rent, food, education, etc.
| Items | Expenditure (in ₹) |
| House rent | 3000 |
| Food | 3400 |
| Education | 800 |
| Electricity | 400 |
| Transport | 600 |
| Miscellaneous | 1200 |
Steps to Draw the Bar Graph:
-
Draw two perpendicular axes – X-axis (items) and Y-axis (expenditure in ₹).
-
Mark the items on the X-axis at equal distances.
-
Choose a scale on the Y-axis:
→ Here, 1 unit = ₹200 -
Divide each expenditure by ₹200 to get the number of bar units:
House rent 3000 ÷ 200 15 units Food 3400 ÷ 200 17 units Education 800 ÷ 200 4 units Electricity 400 ÷ 200 2 units Transport 600 ÷ 200 3 units Transport 1200 ÷ 200 6 units -
Draw bars of equal width and height based on these units.
Key Points summary
-
Bar graphs use equal-width bars to represent numerical data visually.
-
Types: Vertical (bars go up) and Horizontal (bars go sideways).
-
Essential components: Two axes, equal spacing, uniform bar width, scale, title, and labels.
-
Choose a scale so data divides evenly and fits the graph.
Test Yourself
Video Tutorials
Shaalaa.com | How To Draw A Bar Graph?
Related QuestionsVIEW ALL [35]
The number of Mathematics books sold by a shopkeeper on six consecutive days is shown below:
| Days | Sunday | Monday | Tuesday | Wednesday | Thursday | Friday |
| Number of books sold |
65 | 40 | 30 | 50 | 20 | 70 |
Draw a bar graph to represent the above information choosing the scale of your choice.
Students planted trees in 5 villages of Sangli district. Make a bar graph of this data. (Scale: on Y-axis, 1cm = 100 trees)
| Name of place | Dudhgaon | Bagni | Samdoli | Ashta | Kavathepiran |
| No. of trees planted | 500 | 350 | 600 | 420 | 540 |
The score card of the players in a cricket match is given.
| Player Name | Score |
| Kannan | 60 |
| Rohit | 40 |
| Babu | 50 |
| Ramu | 10 |
Draw a Bar diagram
The names and numbers of animals in a certain zoo are given below. Use the data to make a bar graph. (Scale : on Y - axis, 1cm = 4 animals)
| Animals | Deer | Tiger | Monkey | Rabbit | Peacock |
| Number | 20 | 4 | 12 | 16 | 8 |
The table below gives the number of children who took part in the various items of the talent show as part of the annual school gathering. Make a bar graph to show this data.
(Scale: on Y-axis, 1cm = 4 children)
| Programme | Theatre | Dance | Vocal music | Instrumental music | One-act plays |
| No. of students | 24 | 40 | 16 | 8 | 4 |
The following table shows the number of bicycles manufactured in a factory from the years 1998 to 2002. Illustrate this data using a bar graph. Choose a scale of your choice.
| Years | Number of bicycles manufactured |
| 1998 | 800 |
| 1999 | 600 |
| 2000 | 900 |
| 2001 | 1100 |
| 2002 | 1200 |
- In which year was the maximum number of bicycles manufactured?
- In which year was the minimum number of bicycles manufactured?
Complete the given table and draw a graph.
| x | 0 | 1 | 2 | 3 |
| y = 3x + 1 | 1 | 4 | - | - |
