Advertisements
Advertisements
प्रश्न
A student carries out an experiment and plots the V-I graph of three samples of nichrome wire with resistances R1, R2 and R3 respectively. Which of the following is true?

विकल्प
R1 = R2 = R3
R1 > R2 > R3
R3 > R2 > R1
R2 > R3 > R1
Advertisements
उत्तर
R3 > R2 > R1
Explanation -
Since the current (I) is plotted on y-axis and potential difference (V) is plotted on x-axis, so the slope of the graph is `1/"R"`. It means higher the slope, the lesser is the resistance. So, R1 will be minimum and R3 will be maximum.
APPEARS IN
संबंधित प्रश्न
If the potential difference across the ends of a conductor is 220 V and the resistance of the conductor is 44 Ω (ohm), then the current flowing through is _________.
- 0.2 A
- 0.5 A
- 2 A
- 5 A
Will current flow more easily through a thick wire or a thin wire of the same material, when connected to the same source? Why?
Is Ohm’s law universally applicable for all conducting elements? If not, give examples of elements which do not obey Ohm’s law.
A car bulb connected to a 12 volt battery draws 2 A current when glowing. What is the resistance of the filament of the bulb? Will the resistance be more same or less when the bulb is not glowing?
A wire of resistance 3 ohm and length 10 cm is stretched to length 30 cm. Assuming that it has a uniform cross section, what will be its new resistance?
A wire of resistance 9 ohm having length 30 cm is tripled on itself. What is its new resistance?
A wire has a length of 2.0 m and a resistance of 5.0 Ω. Find the electric field existing inside the wire if it carries a current of 10 A.
Consider the sacle of voltmeter shown in the diagram and answer the following questions :

(a) What is the least count of the voltmeter?
(b) What is the reading shown by the voltmeter ?
(c) If the voltmeter is connected across a resistor of 20 `Omega` how much current is flowing through the resistor?
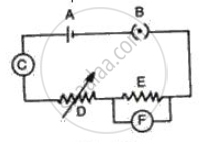
Fig. represents the circuit used for the verification of ohm's law. Label the different parts from A and F. State the function of each.
Tick(✓) the correct choice in the following:
Ohm's law is applicable to
What is meant by the drift speed of free electrons?
An electronics hobbyist is building a radio which requires 150 Ω in her circuit, but she has only 220 Ω, 79 Ω, and 92 Ω resistors available. How can she connect the available resistors to get the desired value of resistance?
Two cells each of 5V are connected in series across an 8Ω resistor and three parallel resistors of 4Ω, 6Ω, and 12Ω. Draw a circuit diagram for the above arrangement. Calculate
- the current drawn from the cell
- current through each resistor
A student carries out an experiment and plots the V-I graph of three samples of nichrome wire with resistances R1, R2 and R3 respectively. Which of the following is hue?

Consider a current carrying wire (current I) in the shape of a circle. Note that as the current progresses along the wire, the direction of j (current density) changes in an exact manner, while the current I remain unaffected. The agent that is essentially responsible for is ______.
Two cells of same emf E but internal resistance r1 and r2 are connected in series to an external resistor R (Figure). What should be the value of R so that the potential difference across the terminals of the first cell becomes zero.
Two conductors are made of the same material and have the same length. Conductor A is a solid wire of diameter 1 mm. Conductor B is a hollow tube of outer diameter 2 mm and inner diameter 1 mm. Find the ratio of resistance RA to RB.
State Ohm's Law. Represent it mathematically.
The circuit depicted in the figure is employed for studying Ohm’s Law. Instead of using a standard resistor, a student opts for a glass tube filled with mercury (tube 1), connected to the circuit through two electrodes, E1 and E2. He records the readings of the ammeter and voltmeter, thereby calculating the resistance. The student repeats the experiment by substituting tube 1 with tube 2, where the same amount of mercury fills tube 2.
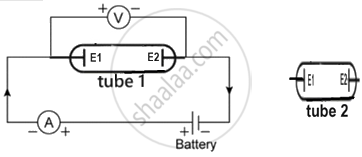
Neglecting internal resistance of the cell use (> or < or =) to compare:
- the resistance in both the cases.
- the voltmeter readings in both the cases.
- the specific resistance in both the cases.
From Ohm's Law, since \[I \propto V\], the constant ratio \[\frac{V}{I}\] is defined as:
