Advertisements
Online Mock Tests
Chapters
![SCERT Maharashtra solutions for Algebra (Mathematics 1) [English] Standard 10 Maharashtra State Board chapter 6 - Statistics - Shaalaa.com](/images/algebra-mathematics-1-english-standard-10-maharashtra-state-board_6:5f2b1b2038084cf381bfa42c826a928c.jpg "SCERT Maharashtra solutions for Algebra (Mathematics 1) [English] Standard 10 Maharashtra State Board chapter 6 - Statistics")
Advertisements
Solutions for Chapter 6: Statistics
Below listed, you can find solutions for Chapter 6 of Maharashtra State Board SCERT Maharashtra for Algebra (Mathematics 1) [English] Standard 10 Maharashtra State Board.
SCERT Maharashtra solutions for Algebra (Mathematics 1) [English] Standard 10 Maharashtra State Board 6 Statistics Q.1 (A)
MCQ
Following table shows the percentage of donors as per the blood group, the central angle for the group ‘O’ is:
| Blood group | O | A | B | AB |
| % Of persons | 60 | 20 | 15 | 5 |
72°
108°
216°
54°
If the following information that is budget of a family is shown as a pie graph, then central angle for clothing is:
| Head | Rent | Clothing | Eduaction | Saving | Food | Miscellaneous |
| Expenditure | Rs. 2400 | Rs. 1800 | Rs. 1200 | Rs. 1200 | Rs. 4800 | Rs. 600 |
72°
54°
36°
18°
The class mark of the class 15 – 20 is ______.
17.5
15.5
17
18.5
If assumed mean (A) = 57.5 Σfidi = –10 and Σfi = 80 then Mean = ______.
57.625
57.125
57.375
57.275
Which of the following is not a measure of central tendency?
Median
Deviation
Mode
Mean
If the mean of frequency distribution is 34.9, Σfixi = 1000 + a, Σfi = 30 then the value of a = ______.
47
48
42
45
A box contains nails of different lengths as shown below, the median class will be:
| Length (in cm) | 2.0 – 2.5 | 2.5 – 3.0 | 3.0 – 3.5 | 3.5 – 4.0 | 4.0 – 4.5 |
| No. of nails | 5 | 18 | 7 | 11 | 9 |
2.5 – 3.0
3.0 – 3.5
3.5 – 4.0
4.0 – 4.5
Look at the pie diagram showing number of skilled workers in different fields the number of workers in the production is ---------- if total number of workers is 10,000
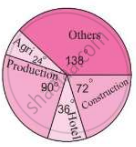
2000
1500
2500
3500
Class marks in a grouped frequency table are useful to find:
Mean
Median
Mode
All of these
The above data is to be shown by a frequency polygon. The coordinates of the points to show number of students in the class 130 – 140 are:
| Heights (in cm) | 100 - 110 | 110 - 120 | 120 - 130 | 130 - 140 | 140 - 150 |
| No. of students | 6 | 8 | 14 | 10 | 4 |
(130, 10)
(135, 10)
(10, 135)
(10, 130)
SCERT Maharashtra solutions for Algebra (Mathematics 1) [English] Standard 10 Maharashtra State Board 6 Statistics Q.1 (B)
Attempt the following sub questions.
Find the class mark of the class 55 – 60.
Write the Modal class
| Class interval | 10 – 15 | 15 – 20 | 20 – 25 | 25 – 30 | 30 – 35 |
| Frequency | 30 | 35 | 40 | 75 | 15 |
Marks of 60 students in a class are tabulated below. For finding mode the Lower limit of modal class (L) = --------
| Marks | 10 – 19 | 20 – 29 | 30 – 39 | 40 – 49 | 50 – 59 | 60 – 69 |
| Number of students | 3 | 8 | 16 | 12 | 10 | 8 |
Observe the adjacent pie diagram. It shows the percentages of number of vehicles passing a signal in a town between 8 am and 10 am. Find central angle for cars.
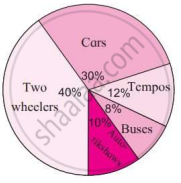
The table given below gives the marks of 160 students in the school.
| Marks | 20 – 30 | 30 – 40 | 40 – 50 | 50 – 60 | 60 – 70 | 70 – 80 | 80 – 90 | 90 – 100 |
| No. of students | 8 | 10 | 15 | 25 | 30 | 38 | 24 | 10 |
How many students are getting above 80 marks.
If the mean of the frequency distribution is 8.1 and Σfixi = 132 + 5k, Σfi = 20 then find k.
SCERT Maharashtra solutions for Algebra (Mathematics 1) [English] Standard 10 Maharashtra State Board 6 Statistics Q.2 (A)
Complete the following activities.
Observe the frequency polygon and complete the table.
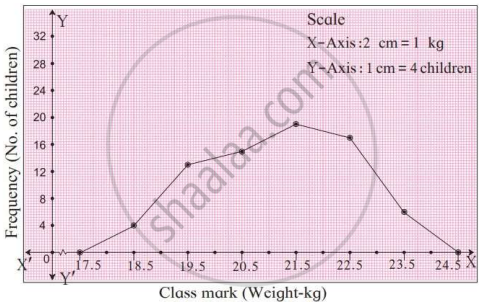
| Class | 18 – 19 | 19 – 20 | 20 – 21 | 21 – 22 | 22 – 23 | 23 – 24 |
| Class mark | 18.5 | `square` | 20.5 | 21.5 | `square` | 23.5 |
| Frequency | 4 | 13 | 15 | 19 | 17 | 6 |
| Coordinates of points |
(18.5, 4) | (19.5, 13) | `square` | (21.5, 19) | `square` | (23.5, 6) |
Complete the following table to find the mean.
| Weekly wages (Rupees) |
Class mark (xi) |
No. of workers (fi) |
fixi |
| 0 – 2000 | 1000 | 15 | 15000 |
| 2000 – 4000 | `square` | 35 | 105000 |
| 4000 – 6000 | 5000 | 50 | 250000 |
| 6000 – 8000 | 7000 | 20 | 140000 |
| N = 120 | Σfixi = `square` |
Mean = `(sumf_ix_i)/(sumf_i)`
= `square/120`
= `square`
The following table shows causes of noise pollution. Complete the table to draw a pie diagram.
| Causes | Percentage | Central angle |
| Construction | 10% | `square` |
| Traffic | `square` | 180° |
| Aircraft take off | 9% | `square` |
| Industry | 20% | `square` |
| Trains | 11% | 39.6 |
Complete the following activity to find median.
| Class (Student's marks) |
No. of students fi |
Cumulative frequency less than the upper limit cf |
| 0 – 20 | 4 | 4 |
| 20 – 40 | 20 | 24 |
| 40 – 60 | 30 | 54 |
| 60 – 80 | 40 | 94 |
| 80 – 100 | 6 | 100 |
Here, L = `square`, N = 100, `N/2 = 50`, c.f. = 24, f = 30, h = 20
Median = `square` ...(Formula)
= `square`
Median marks = `square`
SCERT Maharashtra solutions for Algebra (Mathematics 1) [English] Standard 10 Maharashtra State Board 6 Statistics Q.2 (B)
Solve the following sub questions.
For the table given below find cumulative frequency table.
| Daily No. of hours | 8 – 10 | 10 – 12 | 12 – 14 | 14 – 16 |
| Number of workers | 150 | 500 | 300 | 50 |
Find the mode for the following frequency distribution.
| Class | 1 – 10 | 11 – 20 | 21 – 30 | 31 – 40 | 41 – 50 |
| Frequency | 2 | 3 | 5 | 7 | 1 |
Use formula: Mode = `L = (f_0 - f_1)/(2f_0 - f_1 - f_2) xx h`
Find mean of the following table.
| Difference in ages (in years) |
No. of couples (fi) |
| 0 – 2 | 1 |
| 2 – 4 | 2 |
| 4 – 6 | 8 |
| 6 – 8 | 5 |
| 8 – 10 | 3 |
| 10 – 12 | 1 |
SCERT Maharashtra solutions for Algebra (Mathematics 1) [English] Standard 10 Maharashtra State Board 6 Statistics Q.3 (A)
Complete the following activity.
The following table shows the funds collected by 50 students for flood affected people. Find the mean of the funds.
| Fund (Rupees) | 0 – 1000 | 1000 – 1500 | 1500 – 2000 | 2000 – 3000 |
| No. of students | 6 | 24 | 18 | 2 |
Solution: Let A = 1250, examining all di,g = 250.
| Class Fund (₹) |
Class mark xi |
di = xi – A = xi – 1250 |
`u_i = d_i/g` | Frequency fi |
fiui |
| 0 – 1000 | 500 | `square` | –3 | 6 | –18 |
| 1000 – 1500 | 1250 → A | 0 | 0 | 24 | 0 |
| 1500 – 2000 | 1750 | 500 | 2 | 18 | `square` |
| 2000 – 3000 | 2500 | 1250 | `square` | 2 | 10 |
| Total | Σfi = 50 | Σfiui = 28 |
`baru = (sumf_iu_i)/(sumf_i) = 28/50 = square`
`barug = square xx 250 = square`
`barx = A + gbaru = 1250 + 140 = 1390`
∴ The average of the funds is ₹ 1390.
Complete the activity to find mean by direct method.
| Weekly wages (Rupees) |
Class mark (xi) |
No. of workers (fi) |
xifi |
| 1000 – 2000 | 1500 | 25 | 37500 |
| 2000 – 3000 | `square` | 45 | 112500 |
| 3000 – 4000 | 3500 | 50 | `square` |
| 4000 – 5000 | 4500 | 30 | `square` |
| N = 150 | Σfixi = `square` |
Mean = `(sumf_ix_i)/(sumf_i)`
= `square/150`
= `square`
Complete the following activity to find median marks of the students.
| Class (Student's marks) |
No. of students fi |
Cumulative frequency less than the upper limit cf |
| 0 – 20 | 4 | 4 |
| 20 – 40 | 20 | 24 |
| 40 – 60 | 30 | 54 |
| 60 – 80 | 40 | 94 |
| 80 – 100 | 6 | 100 |
Here, L = `square`, N = 100, `N/2 = 50`, c.f. = `square`, f = 30, h = 20
Median = `L + (N/2 - c.f)/f xx h` ...(Formula)
= `square` ...(Keeping values in the formula)
= `square + square/30 xx 20`
Median marks = `square`
The table below gives the ages of 120 drivers of cars involved in accidents during a certain year. Complete the table and draw a pie diagram.
| Age of driver (in years) |
Number of drivers |
Central angle |
| Under 20 | 25 | 75° |
| 20 – 40 | 50 | `square` |
| 40 – 60 | 35 | 105° |
| Over 60 | 10 | 30° |
SCERT Maharashtra solutions for Algebra (Mathematics 1) [English] Standard 10 Maharashtra State Board 6 Statistics Q.3 (B)
Solve the following.
Draw the histogram.
| Wages (in ₹) | 40 – 50 | 50 – 60 | 60 – 70 | 70 – 80 | 80 – 90 |
| No. of workers | 3 | 8 | 12 | 6 | 4 |
In a school the weekly pocket money of 50 students is as follows. Find mode of pocket money.
| Pocket money (in ₹) | 40 – 50 | 50 – 60 | 60 – 70 | 70 – 80 | 80 – 90 | 90 – 100 |
| No. of students | 2 | 8 | 12 | 14 | 8 | 6 |
Draw frequency polygon of the following distribution.
| Weight of packet | 0 – 5 | 5 – 10 | 10 – 15 | 15 – 20 | 20 – 25 |
| Number of packets | 3 | 5 | 8 | 5 | 4 |
SCERT Maharashtra solutions for Algebra (Mathematics 1) [English] Standard 10 Maharashtra State Board 6 Statistics Q.4
Attempt the following sub questions.
Find the mean by step deviation method.
| Class | 10 – 15 | 15 – 20 | 20 – 25 | 25 – 30 | 30 – 35 | 35 – 40 |
| Frequency | 5 | 6 | 8 | 12 | 6 | 3 |
If the mean of the weight of packet is 12.9 gm. Find the value of b.
| Weight of packet | 0 – 5 | 5 – 10 | 10 – 15 | 15 – 20 | 20 – 25 |
| Number of packets | 3 | b | 8 | 5 | 4 |
Find the mode for the following distribution.
| Ages (in years) | 1 – 10 | 11 – 20 | 21 – 30 | 31 – 40 | 41 – 50 |
| No. of children | 2 | 3 | 5 | 7 | 1 |
Calculate the missing frequency from the following distribution, it being given that the median of the distribution is 24.
| Age in years | 0 – 10 | 10 – 20 | 20 – 30 | 30 – 40 | 40 – 50 |
| No. of persons | 5 | 25 | ? | 18 | 7 |
Draw histogram and frequency polygon.
| Max. temp. | 24 – 28 | 28 – 32 | 32 – 36 | 36 – 40 | 40 – 44 |
| No. of towns | 4 | 5 | 7 | 8 | 6 |
SCERT Maharashtra solutions for Algebra (Mathematics 1) [English] Standard 10 Maharashtra State Board 6 Statistics Q.5
Solve the following sub question.
The angles of a triangle ABC are in the ratio 1 : 2 : 3, show this information in pie diagram.
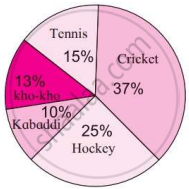
120 students of standard 10 were asked which game they like and from this information pie chart is prepared, observe the pie diagram and answer the questions.
- How many students like to play Tennis?
- What will be central angle for Kho-Kho?
- How many students like Kabaddi?
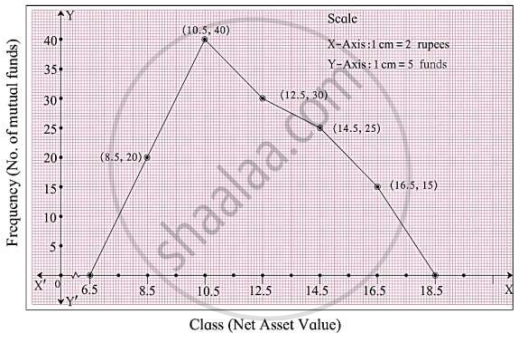
Observe the frequency polygon given alongside. Prepare frequency table and find mean of the net asset value.
Solutions for 6: Statistics
SCERT Maharashtra solutions for Algebra (Mathematics 1) [English] Standard 10 Maharashtra State Board chapter 6 - Statistics
Shaalaa.com has the Maharashtra State Board Mathematics Algebra (Mathematics 1) [English] Standard 10 Maharashtra State Board Maharashtra State Board solutions in a manner that help students grasp basic concepts better and faster. The detailed, step-by-step solutions will help you understand the concepts better and clarify any confusion. SCERT Maharashtra solutions for Mathematics Algebra (Mathematics 1) [English] Standard 10 Maharashtra State Board Maharashtra State Board 6 (Statistics) include all questions with answers and detailed explanations. This will clear students' doubts about questions and improve their application skills while preparing for board exams.
Further, we at Shaalaa.com provide such solutions so students can prepare for written exams. SCERT Maharashtra textbook solutions can be a core help for self-study and provide excellent self-help guidance for students.
Concepts covered in Algebra (Mathematics 1) [English] Standard 10 Maharashtra State Board chapter 6 Statistics are Histograms, Frequency Polygon, Concepts of Statistics, Mean of Grouped Data, Median of Grouped Data, Mode of Grouped Data, Pictorial Representation of Statistical Data, Pie Diagram, Measures of Central Tendency for Different Data Types, Histograms, Frequency Polygon, Concepts of Statistics, Mean of Grouped Data, Median of Grouped Data, Mode of Grouped Data, Pictorial Representation of Statistical Data, Pie Diagram, Measures of Central Tendency for Different Data Types.
Using SCERT Maharashtra Algebra (Mathematics 1) [English] Standard 10 Maharashtra State Board solutions Statistics exercise by students is an easy way to prepare for the exams, as they involve solutions arranged chapter-wise and also page-wise. The questions involved in SCERT Maharashtra Solutions are essential questions that can be asked in the final exam. Maximum Maharashtra State Board Algebra (Mathematics 1) [English] Standard 10 Maharashtra State Board students prefer SCERT Maharashtra Textbook Solutions to score more in exams.
Get the free view of Chapter 6, Statistics Algebra (Mathematics 1) [English] Standard 10 Maharashtra State Board additional questions for Mathematics Algebra (Mathematics 1) [English] Standard 10 Maharashtra State Board Maharashtra State Board, and you can use Shaalaa.com to keep it handy for your exam preparation.
