Advertisements
Advertisements
Question
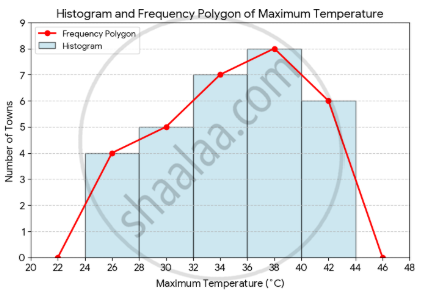
Draw histogram and frequency polygon.
| Max. temp. | 24 – 28 | 28 – 32 | 32 – 36 | 36 – 40 | 40 – 44 |
| No. of towns | 4 | 5 | 7 | 8 | 6 |
Advertisements
Solution
1. Prepare data table
To draw the frequency polygon, calculate the class mark (midpoint) for each class interval using the formula:
Class Mark = `("Lower Limit" + "Upper Limit")/2`
Additionally, create two imaginary classes with a frequency of 0 at both ends (20 – 24 and 44 – 48) to anchor the polygon to the horizontal axis.
| Max.Temperature (C°) |
Class Mark (Midpoint) |
No. of Towns (Frequency) |
Points for Polygon (x, y) |
| 20 – 24 (Imaginary) | 22 | 0 | (22, 0) |
| 24 – 28 | 26 | 4 | (26, 4) |
| 28 – 32 | 30 | 5 | (30, 5) |
| 32 – 36 | 34 | 7 | (34, 7) |
| 36 – 40 | 38 | 8 | (38, 8) |
| 40 – 44 | 42 | 6 | (42, 6) |
| 44 – 48 (Imaginary) | 46 | 0 | (46, 0) |
2. Draw histogram
3. Plot frequency polygon
Identify coordinates: Locate the center top point of each histogram bar, which corresponds to the coordinates (Class Mark, Frequency).
Connect the points: Join the consecutive points with straight line segments.
Close the polygon: Extend the lines to the imaginary points (22, 0) and (46, 0) on the X-axis to complete a closed geometric polygon figure.
