Advertisements
Advertisements
Question
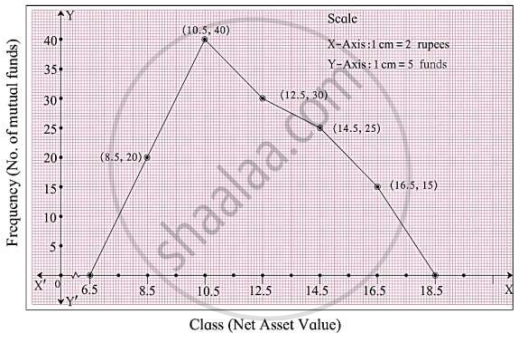
Observe the frequency polygon given alongside. Prepare frequency table and find mean of the net asset value.
Sum
Advertisements
Solution
1. Determining the class intervals
The x-coordinates of the points plotted on the frequency polygon represent the class marks (xi).
The difference between two consecutive class marks is:
Class width (g) = 10.5 – 8.5 = 2
Using the class width, the lower and upper limits of each class interval are calculated as:
Lower limit = `x_i - g/2`
= xi – 1
Upper limit = `x_i + g/2`
= xi + 1
2. Frequency table
| Class (Net Asset Value) |
Class Mark (xi) |
Frequency (No. of funds, fi) |
Product (fi × xi) |
| 7.5 – 9.5 | 8.5 | 20 | 170 |
| 9.5 – 11.5 | 10.5 | 40 | 420 |
| 11.5 – 13.5 | 12.5 | 30 | 375 |
| 13.5 – 15.5 | 14.5 | 25 | 362.5 |
| 15.5 – 17.5 | 16.5 | 15 | 247.5 |
| Total | Σfi = 130 | Σfixi = 1575 |
3. Calculating the mean
Using the direct method formula for grouped data:
Mean `(barx) = (sumf_ix_i)/(sumf_i)`
`(barx) = 1575/130 ≈ 12.1154`
Thus, the mean of the net asset value is approximately 12.12.
shaalaa.com
Is there an error in this question or solution?
