Advertisements
Advertisements
Question
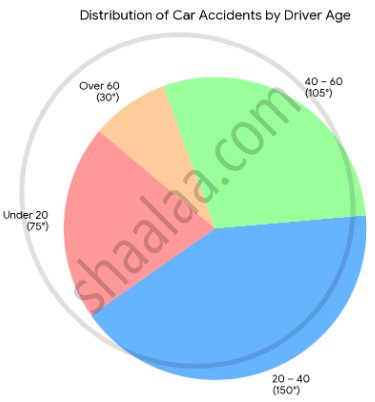
The table below gives the ages of 120 drivers of cars involved in accidents during a certain year. Complete the table and draw a pie diagram.
| Age of driver (in years) |
Number of drivers |
Central angle |
| Under 20 | 25 | 75° |
| 20 – 40 | 50 | `square` |
| 40 – 60 | 35 | 105° |
| Over 60 | 10 | 30° |
Chart
Complete the Table
Advertisements
Solution
1. Completed table
| Age of driver (in years) |
Number of drivers |
Central angle |
| Under 20 | 25 | 75° |
| 20 – 40 | 50 | \[\boxed{150°}\] |
| 40 – 60 | 35 | 105° |
| Over 60 | 10 | 30° |
| Total | 120 | 360° |
2. Pie diagram
shaalaa.com
Is there an error in this question or solution?
