Please select a subject first
Advertisements
Advertisements
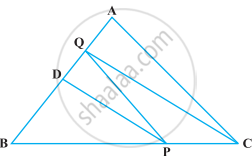
In ∆ABC, D is the mid-point of AB and P is any point on BC. If CQ || PD meets AB in Q (Figure), then prove that ar (BPQ) = `1/2` ar (∆ABC).
Concept: undefined >> undefined
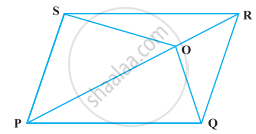
O is any point on the diagonal PR of a parallelogram PQRS (Figure). Prove that ar (PSO) = ar (PQO).
Concept: undefined >> undefined
Advertisements
A point E is taken on the side BC of a parallelogram ABCD. AE and DC are produced to meet at F. Prove that ar (ADF) = ar (ABFC)
Concept: undefined >> undefined
The medians BE and CF of a triangle ABC intersect at G. Prove that the area of ∆GBC = area of the quadrilateral AFGE.
Concept: undefined >> undefined
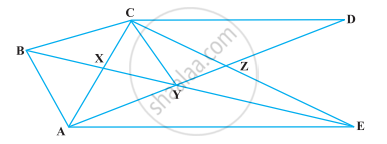
In the following figure, CD || AE and CY || BA. Prove that ar (CBX) = ar (AXY).
Concept: undefined >> undefined
In ∆ABC, if L and M are the points on AB and AC, respectively such that LM || BC. Prove that ar (LOB) = ar (MOC)
Concept: undefined >> undefined
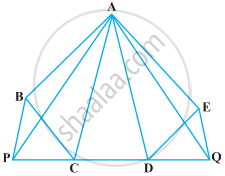
In the following figure, ABCDE is any pentagon. BP drawn parallel to AC meets DC produced at P and EQ drawn parallel to AD meets CD produced at Q. Prove that ar (ABCDE) = ar (APQ)
Concept: undefined >> undefined
If the medians of a ∆ABC intersect at G, show that ar (AGB) = ar (AGC) = ar (BGC) = `1/3` ar (ABC)
Concept: undefined >> undefined
In the following figure, X and Y are the mid-points of AC and AB respectively, QP || BC and CYQ and BXP are straight lines. Prove that ar (ABP) = ar (ACQ).

Concept: undefined >> undefined
Through three collinear points a circle can be drawn.
Concept: undefined >> undefined
ABCD is such a quadrilateral that A is the centre of the circle passing through B, C and D. Prove that ∠CBD + ∠CDB = `1/2` ∠BAD
Concept: undefined >> undefined
The radius of a hemispherical balloon increases from 6 cm to 12 cm as air is being pumped into it. The ratios of the surface areas of the balloon in the two cases is ______.
Concept: undefined >> undefined
The frequency distribution has been represented graphically as follows:
| Marks | 0 – 20 | 20 – 40 | 40 – 60 | 60 – 100 |
| Number of Students | 10 | 15 | 20 | 25 |

Do you think this representation is correct? Why?
Concept: undefined >> undefined
In a diagnostic test in mathematics given to students, the following marks (out of 100) are recorded:
46, 52, 48, 11, 41, 62, 54, 53, 96, 40, 98, 44
Which ‘average’ will be a good representative of the above data and why?
Concept: undefined >> undefined
Is it correct to say that in a histogram, the area of each rectangle is proportional to the class size of the corresponding class interval? If not, correct the statement.
Concept: undefined >> undefined
The expenditure of a family on different heads in a month is given below:
| Head | Food | Education | Clothing | House Rent | Others | Savings |
| Expenditure (in Rs) |
4000 | 2500 | 1000 | 3500 | 2500 | 1500 |
Draw a bar graph to represent the data above.
Concept: undefined >> undefined
Expenditure on Education of a country during a five year period (2002-2006), in crores of rupees, is given below:
| Elementary education | 240 |
| Secondary Education | 120 |
| University Education | 190 |
| Teacher’s Training | 20 |
| Social Education | 10 |
| Other Educational Programmes | 115 |
| Cultural programmes | 25 |
| Technical Education | 125 |
Represent the information above by a bar graph.
Concept: undefined >> undefined
The following table gives the frequencies of most commonly used letters a, e, i, o, r, t, u from a page of a book:
| Letters | a | e | i | o | r | t | u |
| Frequency | 75 | 125 | 80 | 70 | 80 | 95 | 75 |
Represent the information above by a bar graph.
Concept: undefined >> undefined
In the following figure, there is a histogram depicting daily wages of workers in a factory. Construct the frequency distribution table.

Concept: undefined >> undefined
Draw a histogram of the following distribution:
| Heights (in cm) | Number of students |
| 150 – 153 | 7 |
| 153 – 156 | 8 |
| 156 – 159 | 14 |
| 159 – 162 | 10 |
| 162 – 165 | 6 |
| 165 – 168 | 5 |
Concept: undefined >> undefined
