Please select a subject first
Advertisements
Advertisements
The following data on the number of girls (to the nearest ten) per thousand boys in different sections of Indian society is given below.
| Section | Number of girls per thousand boys |
| Scheduled Caste (SC) | 940 |
| Scheduled Tribe (ST) | 970 |
| Non SC/ST | 920 |
| Backward districts | 950 |
| Non-backward districts | 920 |
| Rural | 930 |
| Urban | 910 |
- Represent the information above by a bar graph.
- In the classroom discuss what conclusions can be arrived at from the graph.
Concept: undefined >> undefined
Given below are the seats won by different political parties in the polling outcome of a state assembly elections:-
| Political Party | A | B | C | D | E | F |
| Seats Won | 75 | 55 | 37 | 29 | 10 | 37 |
- Draw a bar graph to represent the polling results.
- Which political party won the maximum number of seats?
Concept: undefined >> undefined
Advertisements
The length of 40 leaves of a plant are measured correct to one millimetre, and the obtained data is represented in the following table:-
| Length (in mm) | Number of leaves |
| 118 - 126 | 3 |
| 127 - 135 | 5 |
| 136 - 144 | 9 |
| 145 - 153 | 12 |
| 154 - 162 | 5 |
| 163 - 171 | 4 |
| 172 - 180 | 2 |
- Draw a histogram to represent the given data. [Hint: First make the class intervals continuous]
- Is there any other suitable graphical representation for the same data?
- Is it correct to conclude that the maximum number of leaves are 153 mm long? Why?
Concept: undefined >> undefined
The following table gives the life times of 400 neon lamps:-
| Life time (in hours) | Number of lamps |
| 300 - 400 | 14 |
| 400 - 500 | 56 |
| 500 - 600 | 60 |
| 600 - 700 | 86 |
| 700 - 800 | 74 |
| 800 - 900 | 62 |
| 900 - 1000 | 48 |
- Represent the given information with the help of a histogram.
- How many lamps have a life time of more than 700 hours?
Concept: undefined >> undefined
The following table gives the distribution of students of two sections according to the mark obtained by them:-
| Section A | Section B | ||
| Marks | Frequency | Marks | Frequency |
| 0 - 10 | 3 | 0 - 10 | 5 |
| 10 - 20 | 9 | 10 - 20 | 19 |
| 20 - 30 | 17 | 20 - 30 | 15 |
| 30 - 40 | 12 | 30 - 40 | 10 |
| 40 - 50 | 9 | 40 - 50 | 1 |
Represent the marks of the students of both the sections on the same graph by two frequency polygons. From the two polygons compare the performance of the two sections.
Concept: undefined >> undefined
The runs scored by two teams A and B on the first 60 balls in a cricket match are given below:
| Number of balls | Team A | Team B |
| 1 - 6 | 2 | 5 |
| 7 - 12 | 1 | 6 |
| 13 - 18 | 8 | 2 |
| 19 - 24 | 9 | 10 |
| 25 - 30 | 4 | 5 |
| 31 - 36 | 5 | 6 |
| 37 - 42 | 6 | 3 |
| 43 - 48 | 10 | 4 |
| 49 - 54 | 6 | 8 |
| 55 - 60 | 2 | 10 |
Represent the data of both the teams on the same graph by frequency polygons.
[Hint: First make the class intervals continuous.]
Concept: undefined >> undefined
A random survey of the number of children of various age groups playing in a park was found as follows:
| Age (in years) | Number of children |
| 1 - 2 | 5 |
| 2 - 3 | 3 |
| 3 - 5 | 6 |
| 5 - 7 | 12 |
| 7 - 10 | 9 |
| 10 - 15 | 10 |
| 15 - 17 | 4 |
Draw a histogram to represent the data above.
Concept: undefined >> undefined
100 surnames were randomly picked up from a local telephone directory and a frequency distribution of the number of letters in the English alphabet in the surnames was found as follows:
| Number of letters | Number of surnames |
| 1 - 4 | 6 |
| 4 - 6 | 30 |
| 6 - 8 | 44 |
| 8 - 12 | 16 |
| 12 - 20 | 4 |
- Draw a histogram to depict the given information.
- Write the class interval in which the maximum number of surnames lie.
Concept: undefined >> undefined
Represent `sqrt6,` `sqrt7,` `sqrt8` on the number line.
Concept: undefined >> undefined
Represent `sqrt3.5,` `sqrt9.4,` `sqrt10.5` on the real number line.
Concept: undefined >> undefined
Visualise 2.665 on the number line, using successive magnification.
Concept: undefined >> undefined
Visualise the representation of `5.3bar7` on the number line upto 5 decimal places, that is upto 5.37777.
Concept: undefined >> undefined
In a ΔABC, if ∠A=l20° and AB = AC. Find ∠B and ∠C.
Concept: undefined >> undefined
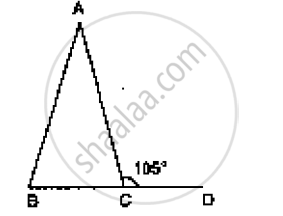
In Figure AB = AC and ∠ACD =105°, find ∠BAC.
Concept: undefined >> undefined
Find the measure of each exterior angle of an equilateral triangle.
Concept: undefined >> undefined
If the base of an isosceles triangle is produced on both sides, prove that the exterior angles so formed are equal to each other.
Concept: undefined >> undefined
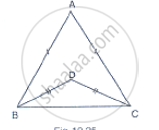
In figure, AB = AC and DB = DC, find the ratio ∠ABD : ∠ACD
Concept: undefined >> undefined
Determine the measure of each of the equal angles of a right-angled isosceles triangle.
Concept: undefined >> undefined
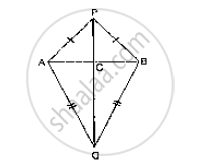
AB is a line seg P and Q are points on opposite sides of AB such that each of them is equidistant from the points A and B (See Fig. 10.26). Show that the line PQ is perpendicular bisector of AB.
Concept: undefined >> undefined
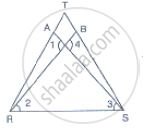
In Fig. 10.40, it is given that RT = TS, ∠1 = 2∠2 and ∠4 = 2∠3. Prove that ΔRBT ≅ ΔSAT
Concept: undefined >> undefined
