Advertisements
Advertisements
Question
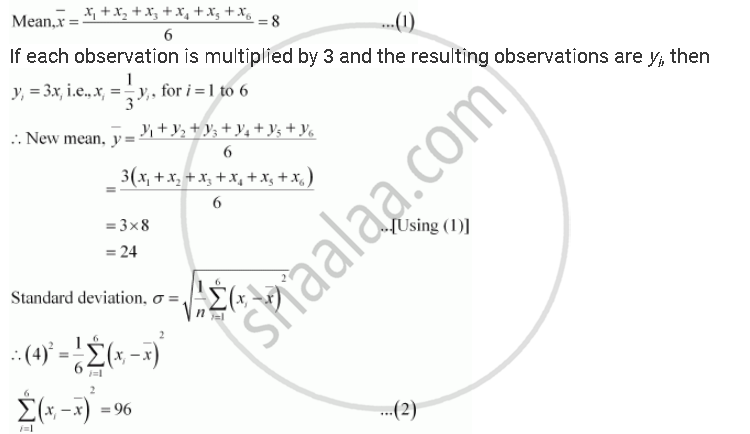
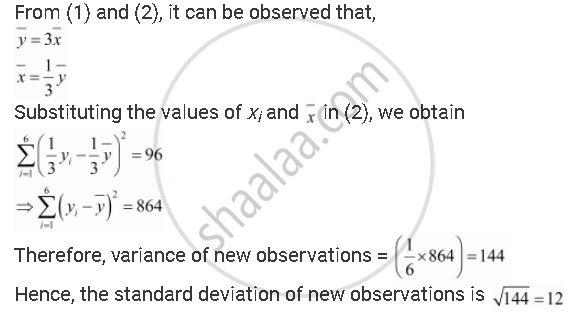
The mean and standard deviation of six observations are 8 and 4, respectively. If each observation is multiplied by 3, find the new mean and new standard deviation of the resulting observations
Advertisements
Solution
Let the observations be x1, x2, x3, x4, x5, and x6.
It is given that mean is 8 and standard deviation is 4.
RELATED QUESTIONS
Find the mean and variance for the data.
6, 7, 10, 12, 13, 4, 8, 12
Find the mean and variance for the first n natural numbers.
Find the mean and variance for the data.
| xi | 92 | 93 | 97 | 98 | 102 | 104 | 109 |
| fi | 3 | 2 | 3 | 2 | 6 | 3 | 3 |
The mean and variance of 7 observations are 8 and 16, respectively. If five of the observations are 2, 4, 10, 12 and 14. Find the remaining two observations.
Given that `barx` is the mean and σ2 is the variance of n observations x1, x2, …,xn. Prove that the mean and variance of the observations ax1, ax2, ax3, …,axn are `abarx` and a2 σ2, respectively (a ≠ 0).
The mean and standard deviation of a group of 100 observations were found to be 20 and 3, respectively. Later on it was found that three observations were incorrect, which were recorded as 21, 21 and 18. Find the mean and standard deviation if the incorrect observations are omitted.
Find the mean, variance and standard deviation for the data:
6, 7, 10, 12, 13, 4, 8, 12.
Find the mean, variance and standard deviation for the data 15, 22, 27, 11, 9, 21, 14, 9.
The mean and standard deviation of 6 observations are 8 and 4 respectively. If each observation is multiplied by 3, find the new mean and new standard deviation of the resulting observations.
The mean and variance of 8 observations are 9 and 9.25 respectively. If six of the observations are 6, 7, 10, 12, 12 and 13, find the remaining two observations.
Show that the two formulae for the standard deviation of ungrouped data
\[\sigma = \sqrt{\frac{1}{n} \sum \left( x_i - X \right)^2_{}}\] and
\[\sigma' = \sqrt{\frac{1}{n} \sum x_i^2 - X^2_{}}\] are equivalent, where \[X = \frac{1}{n}\sum_{} x_i\]
Find the standard deviation for the following distribution:
| x : | 4.5 | 14.5 | 24.5 | 34.5 | 44.5 | 54.5 | 64.5 |
| f : | 1 | 5 | 12 | 22 | 17 | 9 | 4 |
Find the standard deviation for the following data:
| x : | 3 | 8 | 13 | 18 | 23 |
| f : | 7 | 10 | 15 | 10 | 6 |
Calculate the mean and S.D. for the following data:
| Expenditure in Rs: | 0-10 | 10-20 | 20-30 | 30-40 | 40-50 |
| Frequency: | 14 | 13 | 27 | 21 | 15 |
Find the mean and variance of frequency distribution given below:
| xi: | 1 ≤ x < 3 | 3 ≤ x < 5 | 5 ≤ x < 7 | 7 ≤ x < 10 |
| fi: | 6 | 4 | 5 | 1 |
The means and standard deviations of heights ans weights of 50 students of a class are as follows:
| Weights | Heights | |
| Mean | 63.2 kg | 63.2 inch |
| Standard deviation | 5.6 kg | 11.5 inch |
Which shows more variability, heights or weights?
Coefficient of variation of two distributions are 60% and 70% and their standard deviations are 21 and 16 respectively. What are their arithmetic means?
From the data given below state which group is more variable, G1 or G2?
| Marks | 10-20 | 20-30 | 30-40 | 40-50 | 50-60 | 60-70 | 70-80 |
| Group G1 | 9 | 17 | 32 | 33 | 40 | 10 | 9 |
| Group G2 | 10 | 20 | 30 | 25 | 43 | 15 | 7 |
Find the coefficient of variation for the following data:
| Size (in cms): | 10-15 | 15-20 | 20-25 | 25-30 | 30-35 | 35-40 |
| No. of items: | 2 | 8 | 20 | 35 | 20 | 15 |
If the sum of the squares of deviations for 10 observations taken from their mean is 2.5, then write the value of standard deviation.
If X and Y are two variates connected by the relation
In a series of 20 observations, 10 observations are each equal to k and each of the remaining half is equal to − k. If the standard deviation of the observations is 2, then write the value of k.
If each observation of a raw data whose standard deviation is σ is multiplied by a, then write the S.D. of the new set of observations.
The standard deviation of the data:
| x: | 1 | a | a2 | .... | an |
| f: | nC0 | nC1 | nC2 | .... | nCn |
is
If the S.D. of a set of observations is 8 and if each observation is divided by −2, the S.D. of the new set of observations will be
Let a, b, c, d, e be the observations with mean m and standard deviation s. The standard deviation of the observations a + k, b + k, c + k, d + k, e + k is
Let x1, x2, ..., xn be n observations. Let \[y_i = a x_i + b\] for i = 1, 2, 3, ..., n, where a and b are constants. If the mean of \[x_i 's\] is 48 and their standard deviation is 12, the mean of \[y_i 's\] is 55 and standard deviation of \[y_i 's\] is 15, the values of a and b are
Life of bulbs produced by two factories A and B are given below:
| Length of life (in hours) |
Factory A (Number of bulbs) |
Factory B (Number of bulbs) |
| 550 – 650 | 10 | 8 |
| 650 – 750 | 22 | 60 |
| 750 – 850 | 52 | 24 |
| 850 – 950 | 20 | 16 |
| 950 – 1050 | 16 | 12 |
| 120 | 120 |
The bulbs of which factory are more consistent from the point of view of length of life?
A set of n values x1, x2, ..., xn has standard deviation 6. The standard deviation of n values x1 + k, x2 + k, ..., xn + k will be ______.
Mean and standard deviation of 100 observations were found to be 40 and 10, respectively. If at the time of calculation two observations were wrongly taken as 30 and 70 in place of 3 and 27 respectively, find the correct standard deviation.
Let x1, x2, ..., xn be n observations and `barx` be their arithmetic mean. The formula for the standard deviation is given by ______.
Standard deviations for first 10 natural numbers is ______.
If the variance of a data is 121, then the standard deviation of the data is ______.
The mean and standard deviation of six observations are 8 and 4, respectively. If each observation is multiplied by 3, find the new mean and new standard deviation of the resulting observations.
