Advertisements
Advertisements
प्रश्न
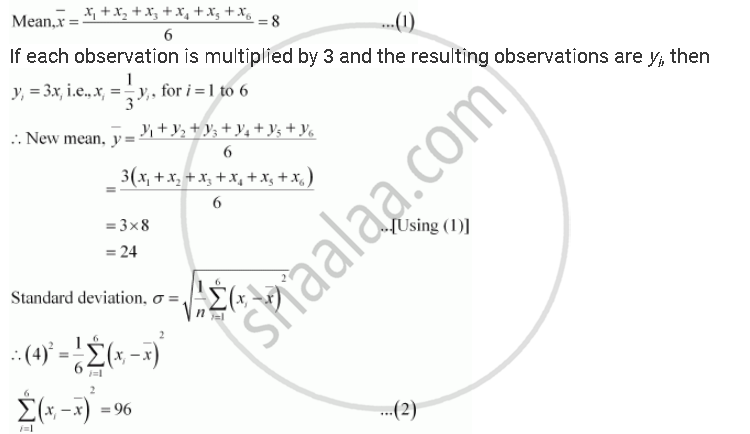
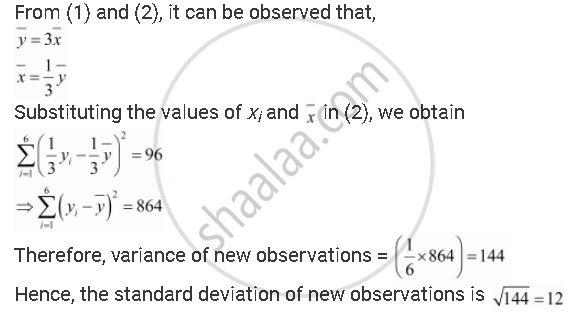
The mean and standard deviation of six observations are 8 and 4, respectively. If each observation is multiplied by 3, find the new mean and new standard deviation of the resulting observations
Advertisements
उत्तर
Let the observations be x1, x2, x3, x4, x5, and x6.
It is given that mean is 8 and standard deviation is 4.
संबंधित प्रश्न
Find the mean and variance for the data.
6, 7, 10, 12, 13, 4, 8, 12
Find the mean and variance for the data.
| xi | 6 | 10 | 14 | 18 | 24 | 28 | 30 |
| fi | 2 | 4 | 7 | 12 | 8 | 4 | 3 |
Find the mean and variance for the data.
| xi | 92 | 93 | 97 | 98 | 102 | 104 | 109 |
| fi | 3 | 2 | 3 | 2 | 6 | 3 | 3 |
The diameters of circles (in mm) drawn in a design are given below:
| Diameters | 33 - 36 | 37 - 40 | 41 - 44 | 45 - 48 | 49 - 52 |
| No. of circles | 15 | 17 | 21 | 22 | 25 |
Calculate the standard deviation and mean diameter of the circles.
[Hint: First make the data continuous by making the classes as 32.5 - 36.5, 36.5 - 40.5, 40.5 - 44.5, 44.5 - 48.5, 48.5 - 52.5 and then proceed.]
The following is the record of goals scored by team A in a football session:
|
No. of goals scored |
0 |
1 |
2 |
3 |
4 |
|
No. of matches |
1 |
9 |
7 |
5 |
3 |
For the team B, mean number of goals scored per match was 2 with a standard deviation 1.25 goals. Find which team may be considered more consistent?
The sum and sum of squares corresponding to length x (in cm) and weight y (in gm) of 50 plant products are given below:
`sum_(i-1)^50 x_i = 212, sum_(i=1)^50 x_i^2 = 902.8, sum_(i=1)^50 y_i = 261, sum_(i = 1)^50 y_i^2 = 1457.6`
Which is more varying, the length or weight?
The mean and variance of eight observations are 9 and 9.25, respectively. If six of the observations are 6, 7, 10, 12, 12 and 13, find the remaining two observations.
The mean and variance of 7 observations are 8 and 16, respectively. If five of the observations are 2, 4, 10, 12 and 14. Find the remaining two observations.
Given that `barx` is the mean and σ2 is the variance of n observations x1, x2, …,xn. Prove that the mean and variance of the observations ax1, ax2, ax3, …,axn are `abarx` and a2 σ2, respectively (a ≠ 0).
Find the mean, variance and standard deviation for the data 15, 22, 27, 11, 9, 21, 14, 9.
For a group of 200 candidates, the mean and standard deviations of scores were found to be 40 and 15 respectively. Later on it was discovered that the scores of 43 and 35 were misread as 34 and 53 respectively. Find the correct mean and standard deviation.
The mean and standard deviation of 100 observations were calculated as 40 and 5.1 respectively by a student who took by mistake 50 instead of 40 for one observation. What are the correct mean and standard deviation?
Find the standard deviation for the following distribution:
| x : | 4.5 | 14.5 | 24.5 | 34.5 | 44.5 | 54.5 | 64.5 |
| f : | 1 | 5 | 12 | 22 | 17 | 9 | 4 |
Calculate the standard deviation for the following data:
| Class: | 0-30 | 30-60 | 60-90 | 90-120 | 120-150 | 150-180 | 180-210 |
| Frequency: | 9 | 17 | 43 | 82 | 81 | 44 | 24 |
Coefficient of variation of two distributions are 60% and 70% and their standard deviations are 21 and 16 respectively. What are their arithmetic means?
From the data given below state which group is more variable, G1 or G2?
| Marks | 10-20 | 20-30 | 30-40 | 40-50 | 50-60 | 60-70 | 70-80 |
| Group G1 | 9 | 17 | 32 | 33 | 40 | 10 | 9 |
| Group G2 | 10 | 20 | 30 | 25 | 43 | 15 | 7 |
Find the coefficient of variation for the following data:
| Size (in cms): | 10-15 | 15-20 | 20-25 | 25-30 | 30-35 | 35-40 |
| No. of items: | 2 | 8 | 20 | 35 | 20 | 15 |
In a series of 20 observations, 10 observations are each equal to k and each of the remaining half is equal to − k. If the standard deviation of the observations is 2, then write the value of k.
If each observation of a raw data whose standard deviation is σ is multiplied by a, then write the S.D. of the new set of observations.
If the S.D. of a set of observations is 8 and if each observation is divided by −2, the S.D. of the new set of observations will be
Show that the two formulae for the standard deviation of ungrouped data.
`sigma = sqrt((x_i - barx)^2/n)` and `sigma`' = `sqrt((x^2_i)/n - barx^2)` are equivalent.
Life of bulbs produced by two factories A and B are given below:
| Length of life (in hours) |
Factory A (Number of bulbs) |
Factory B (Number of bulbs) |
| 550 – 650 | 10 | 8 |
| 650 – 750 | 22 | 60 |
| 750 – 850 | 52 | 24 |
| 850 – 950 | 20 | 16 |
| 950 – 1050 | 16 | 12 |
| 120 | 120 |
The bulbs of which factory are more consistent from the point of view of length of life?
Find the standard deviation of the first n natural numbers.
The mean and standard deviation of a set of n1 observations are `barx_1` and s1, respectively while the mean and standard deviation of another set of n2 observations are `barx_2` and s2, respectively. Show that the standard deviation of the combined set of (n1 + n2) observations is given by
S.D. = `sqrt((n_1(s_1)^2 + n_2(s_2)^2)/(n_1 + n_2) + (n_1n_2 (barx_1 - barx_2)^2)/(n_1 + n_2)^2)`
Two sets each of 20 observations, have the same standard derivation 5. The first set has a mean 17 and the second a mean 22. Determine the standard deviation of the set obtained by combining the given two sets.
Mean and standard deviation of 100 observations were found to be 40 and 10, respectively. If at the time of calculation two observations were wrongly taken as 30 and 70 in place of 3 and 27 respectively, find the correct standard deviation.
Let x1, x2, x3, x4, x5 be the observations with mean m and standard deviation s. The standard deviation of the observations kx1, kx2, kx3, kx4, kx5 is ______.
Standard deviations for first 10 natural numbers is ______.
Coefficient of variation of two distributions are 50 and 60, and their arithmetic means are 30 and 25 respectively. Difference of their standard deviation is ______.
The standard deviation of a data is ______ of any change in orgin, but is ______ on the change of scale.
