Advertisements
Advertisements
Question
The figure shows a plot of stopping potential (V0) versus `1/lambda`, where λ is the wavelength of the radiation causing photoelectric emission from a surface. The slope of the line is equal to ______.

Options
Φ0
`h/e`
`(hc)/e`
`(h^2c)/e^2`
Advertisements
Solution
The figure shows a plot of stopping potential (V0) versus `1/lambda`, where λ is the wavelength of the radiation causing photoelectric emission from a surface. The slope of the line is equal to `underlinebb(h/e)`.
Explanation:
`1/lambda = ν` (frequency)
The photoelectric effect in terms of stopping potential is as follows:
hν = hν0 + eV
Writing this equation in terms of y = mx + c, we get
V = `((hν - hν_0))/e`
On comparing this equation with y = mx + c, we get
`m = h/e`
APPEARS IN
RELATED QUESTIONS
What is the speed of a photon with respect to another photon if (a) the two photons are going in the same direction and (b) they are going in opposite directions?
A hot body is placed in a closed room maintained at a lower temperature. Is the number of photons in the room increasing?
Let nr and nb be the number of photons emitted by a red bulb and a blue bulb, respectively, of equal power in a given time.
The work function of a metal is hv0. Light of frequency v falls on this metal. Photoelectric effect will take place only if
If the frequency of light in a photoelectric experiment is doubled, the stopping potential will ______.
Calculate the momentum of a photon of light of wavelength 500 nm.
(Use h = 6.63 × 10⁻³⁴J-s = 4.14 × 10⁻¹⁵ eV-s, c = 3 × 10⁸ m/s and me = 9.1 × 10⁻³¹kg)
The work function for a metal surface is 4.14 eV. The threshold wavelength for this metal surface is ______.
Which of the following options represents the variation of photoelectric current with property of light shown on the x-axis?
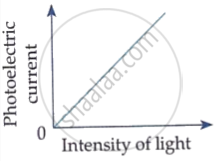
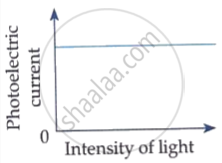
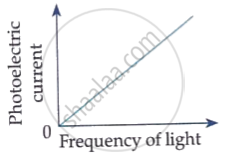
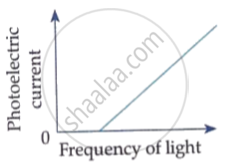
Which plate is kept illuminated by monochromatic radiation?
What happens when the collector is made negative with respect to the emitter?
