Advertisements
Advertisements
प्रश्न
The figure shows a plot of stopping potential (V0) versus `1/lambda`, where λ is the wavelength of the radiation causing photoelectric emission from a surface. The slope of the line is equal to ______.

विकल्प
Φ0
`h/e`
`(hc)/e`
`(h^2c)/e^2`
Advertisements
उत्तर
The figure shows a plot of stopping potential (V0) versus `1/lambda`, where λ is the wavelength of the radiation causing photoelectric emission from a surface. The slope of the line is equal to `underlinebb(h/e)`.
Explanation:
`1/lambda = ν` (frequency)
The photoelectric effect in terms of stopping potential is as follows:
hν = hν0 + eV
Writing this equation in terms of y = mx + c, we get
V = `((hν - hν_0))/e`
On comparing this equation with y = mx + c, we get
`m = h/e`
APPEARS IN
संबंधित प्रश्न
Use the same formula you employ in (a) to obtain electron speed for an collector potential of 10 MV. Do you see what is wrong? In what way is the formula to be modified?
The following graph shows the variation of photocurrent for a photosensitive metal :
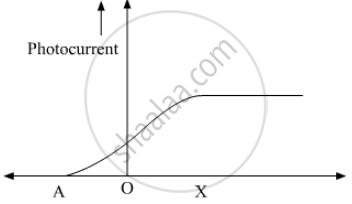
(a) Identify the variable X on the horizontal axis.
(b) What does the point A on the horizontal axis represent?
(c) Draw this graph for three different values of frequencies of incident radiation v1, v2 and v3 (v1 > v2 > v3) for same intensity.
(d) Draw this graph for three different values of intensities of incident radiation I1, I2 and I3 (I1 > I2 > I3) having same frequency.
Planck's constant has the same dimensions as
Calculate the number of photons emitted per second by a 10 W sodium vapour lamp. Assume that 60% of the consumed energy is converted into light. Wavelength of sodium light = 590 nm
(Use h = 6.63 × 10⁻³⁴J-s = 4.14 × 10⁻¹⁵ eV-s, c = 3 × 10⁸ m/s and me = 9.1 × 10⁻³¹kg)
A parallel beam of monochromatic light of wavelength 663 nm is incident on a totally reflecting plane mirror. The angle of incidence is 60° and the number of photons striking the mirror per second is 1.0 × 10¹⁹. Calculate the force exerted by the light beam on the mirror.
(Use h = 6.63 × 10⁻³⁴J-s = 4.14 × 10⁻¹⁵ eV-s, c = 3 × 10⁸ m/s and me = 9.1 × 10⁻³¹kg)
When a metal plate is exposed to a monochromatic beam of light of wavelength 400 nm, a negative potential of 1.1 V is needed to stop the photo current. Find the threshold wavelength for the metal.
(Use h = 6.63 × 10⁻³⁴J-s = 4.14 × 10⁻¹⁵ eV-s, c = 3 × 10⁸ m/s and me = 9.1 × 10⁻³¹kg)
Do all the electrons that absorb a photon come out as photoelectrons?
Consider a thin target (10–2 cm square, 10–3 m thickness) of sodium, which produces a photocurrent of 100 µA when a light of intensity 100W/m2 (λ = 660 nm) falls on it. Find the probability that a photoelectron is produced when a photons strikes a sodium atom. [Take density of Na = 0.97 kg/m3].
How would the stopping potential for a given photosensitive surface change if the frequency of the incident radiation were increased? Justify your answer.
- Assertion (A): For the radiation of a frequency greater than the threshold frequency, the photoelectric current is proportional to the intensity of the radiation.
- Reason (R): Greater the number of energy quanta available, the greater the number of electrons absorbing the energy quanta and the greater the number of electrons coming out of the metal.
