Advertisements
Advertisements
Question
The daily wages of 80 workers in a project are given below.
| Wages (in Rs.) |
400-450 | 450-500 | 500-550 | 550-600 | 600-650 | 650-700 | 700-750 |
| No. of workers |
2 | 6 | 12 | 18 | 24 | 13 | 5 |
Use a graph paper to draw an ogive for the above distribution. (Use a scale of 2 cm = Rs. 50 on x-axis and 2 cm = 10 workers on y-axis). Use your ogive to estimate:
- the median wage of the workers.
- the lower quartile wage of workers.
- the numbers of workers who earn more than Rs. 625 daily.
Advertisements
Solution
The cumulative frequency table of the given distribution is as follows:
| Wages (in Rs.) | Upper limit | No. of workers | Cumulative frequency |
| 400-450 | 450 | 2 | 2 |
| 450-500 | 500 | 6 | 8 |
| 500-550 | 550 | 12 | 20 |
| 550-600 | 600 | 18 | 38 |
| 600-650 | 650 | 24 | 62 |
| 650-700 | 700 | 13 | 75 |
| 700-750 | 750 | 5 | 80 |
The ogive is as follows:
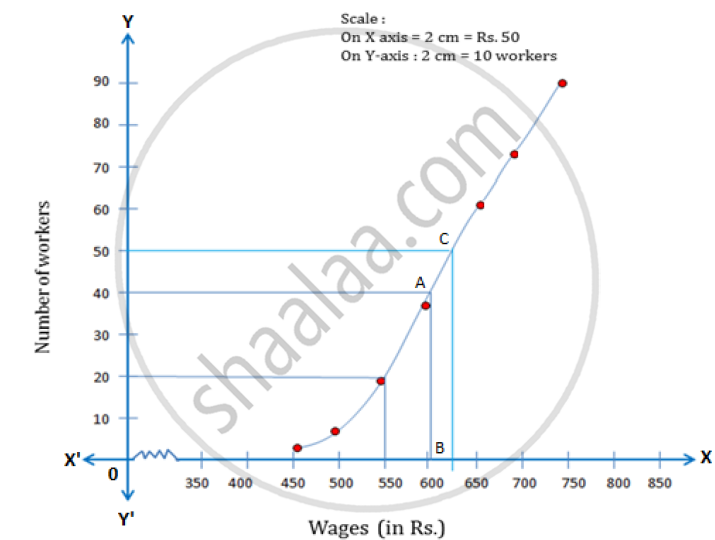
Number of workers = n = 80
i. Median = `(n/2)^"th"` term = 40th term
Through mark 40 on the Y-axis, draw a horizontal line which meets the curve at point A.
Through point A, on the curve draw a vertical line which meets the X-axis at point B
The value of point B on the X-axis is the median, which is 605.
ii. Lower quartile (Q1) = `(80/4)^"th"` term = 20th term = 550
iii. Through mark of 625 on X-axis, draw a verticle line which meets the graph at point C.
Then through point C, draw a horizontal line which meets the Y-axis at the mark of 50.
Thus, the number of workers that earn more than Rs. 625 daily = 80 – 50 = 30.
APPEARS IN
RELATED QUESTIONS
The weight of 50 workers is given below:
| Weight in Kg | 50-60 | 60-70 | 70-80 | 80-90 | 90-100 | 100-110 | 110-120 |
| No. of Workers | 4 | 7 | 11 | 14 | 6 | 5 | 3 |
Draw an ogive of the given distribution using a graph sheet. Take 2 cm = 10 kg on one axis and 2 cm = 5 workers along the other axis. Use a graph to estimate the following:
1) The upper and lower quartiles.
2) If weighing 95 kg and above is considered overweight, find the number of workers who are overweight.
The marks scored by 750 students in an examination are given in the form of a frequency distribution table:
| Marks | No. of students |
| 600 - 640 | 16 |
| 640 - 680 | 45 |
| 680 - 720 | 156 |
| 720 - 760 | 284 |
| 760 - 800 | 172 |
| 800 - 840 | 59 |
| 840 - 880 | 18 |
The following table gives the height of trees:
| Height | No. of trees |
| Less than 7 Less than 14 Less than 21 Less than 28 Less than 35 Less than 42 Less than 49 Less than 56 |
26 57 92 134 216 287 341 360 |
Draw 'less than' ogive and 'more than' ogive.
Draw a cumulative frequency curve (ogive) for the following distributions:
| Class Interval | 10 – 19 | 20 – 29 | 30 – 39 | 40 – 49 | 50 – 59 |
| Frequency | 23 | 16 | 15 | 20 | 12 |
Construct a frequency distribution table for the following distributions:
| Marks (less than) | 0 | 10 | 20 | 30 | 40 | 50 | 60 | 70 | 80 | 90 | 100 |
| Cumulative frequency | 0 | 7 | 28 | 54 | 71 | 84 | 105 | 147 | 180 | 196 | 200 |
Construct a frequency distribution table for the following distributions:
| Marks (more than) | 0 | 10 | 20 | 30 | 40 | 50 | 60 | 70 | 80 | 90 | 100 |
| Cumulative frequency | 100 | 87 | 65 | 55 | 42 | 36 | 31 | 21 | 18 | 7 | 0 |
Find the correct answer from the alternatives given.
Cumulative frequencies in a grouped frequency table are useful to find ______.
Draw an ogive for the following :
| Class Interval | 10-19 | 20-29 | 30-39 | 40-49 | 50-59 |
| Frequency | 28 | 23 | 15 | 20 | 14 |
The frequency distribution of scores obtained by 230 candidates in a medical entrance test is as ahead:
| Cost of living Index | Number of Months |
| 400 - 450 | 20 |
| 450 - 500 | 35 |
| 500 - 550 | 40 |
| 550 - 600 | 32 |
| 600 - 650 | 24 |
| 650 - 700 | 27 |
| 700 - 750 | 18 |
| 750 - 800 | 34 |
| Total | 230 |
Draw a cummulative polygon (ogive) to represent the above data.
Cumulative frequency curve is also called ______.
