Advertisements
Advertisements
प्रश्न
The daily wages of 80 workers in a project are given below.
| Wages (in Rs.) |
400-450 | 450-500 | 500-550 | 550-600 | 600-650 | 650-700 | 700-750 |
| No. of workers |
2 | 6 | 12 | 18 | 24 | 13 | 5 |
Use a graph paper to draw an ogive for the above distribution. (Use a scale of 2 cm = Rs. 50 on x-axis and 2 cm = 10 workers on y-axis). Use your ogive to estimate:
- the median wage of the workers.
- the lower quartile wage of workers.
- the numbers of workers who earn more than Rs. 625 daily.
Advertisements
उत्तर
The cumulative frequency table of the given distribution is as follows:
| Wages (in Rs.) | Upper limit | No. of workers | Cumulative frequency |
| 400-450 | 450 | 2 | 2 |
| 450-500 | 500 | 6 | 8 |
| 500-550 | 550 | 12 | 20 |
| 550-600 | 600 | 18 | 38 |
| 600-650 | 650 | 24 | 62 |
| 650-700 | 700 | 13 | 75 |
| 700-750 | 750 | 5 | 80 |
The ogive is as follows:
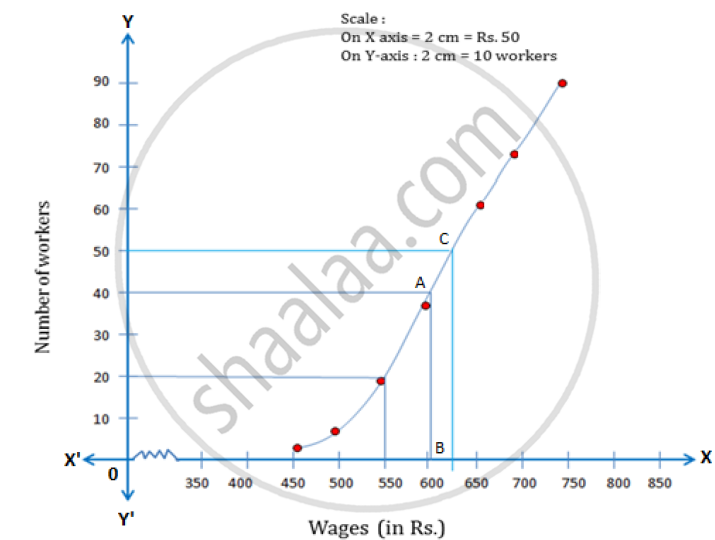
Number of workers = n = 80
i. Median = `(n/2)^"th"` term = 40th term
Through mark 40 on the Y-axis, draw a horizontal line which meets the curve at point A.
Through point A, on the curve draw a vertical line which meets the X-axis at point B
The value of point B on the X-axis is the median, which is 605.
ii. Lower quartile (Q1) = `(80/4)^"th"` term = 20th term = 550
iii. Through mark of 625 on X-axis, draw a verticle line which meets the graph at point C.
Then through point C, draw a horizontal line which meets the Y-axis at the mark of 50.
Thus, the number of workers that earn more than Rs. 625 daily = 80 – 50 = 30.
APPEARS IN
संबंधित प्रश्न
Draw an ogive by less than method for the following data:
| No. of rooms: | 1 | 2 | 3 | 4 | 5 | 6 | 7 | 8 | 9 | 10 |
| No. of houses: | 4 | 9 | 22 | 28 | 24 | 12 | 8 | 6 | 5 | 2 |
The following table gives production yield per hectare of wheat of 100 farms of a village:
| Production yield in kg per hectare: | 50 - 55 | 55 - 60 | 60 - 65 | 65 - 70 | 70 - 75 | 75 - 80 |
| Number of farms: | 2 | 8 | 12 | 24 | 38 | 16 |
Draw ‘less than’ ogive and ‘more than’ ogive.
Draw a cumulative frequency curve (ogive) for the following distributions:
| Class Interval | 10 – 15 | 15 – 20 | 20 – 25 | 25 – 30 | 30 – 35 | 35 – 40 |
| Frequency | 10 | 15 | 17 | 12 | 10 | 8 |
Draw an ogive for the following distributions:
| Marks obtained | less than 10 | less than 20 | less than 30 | less than 40 | less than 50 |
| No. of students | 8 | 25 | 38 | 50 | 67 |
Draw an ogive for the following distributions:
| Age in years (less than) | 10 | 20 | 30 | 40 | 50 | 60 | 70 |
| Cumulative frequency | 0 | 17 | 32 | 37 | 53 | 58 | 65 |
Construct a frequency distribution table for the following distributions:
| Marks (less than) | 0 | 10 | 20 | 30 | 40 | 50 | 60 | 70 | 80 | 90 | 100 |
| Cumulative frequency | 0 | 7 | 28 | 54 | 71 | 84 | 105 | 147 | 180 | 196 | 200 |
The marks obtained by 100 students of a class in an examination are given below.
| Marks | No. of students |
| 0-5 | 2 |
| 5-10 | 5 |
| 10-15 | 6 |
| 15-20 | 8 |
| 20-25 | 10 |
| 25-30 | 25 |
| 30-35 | 20 |
| 35-40 | 18 |
| 40-45 | 4 |
| 45-50 | 2 |
Draw 'a less than' type cumulative frequency curves (orgive). Hence find median
Find the width of class 35 - 45.
Using a graph paper, drawn an Ogive for the following distribution which shows a record of the weight in kilograms of 200 students.
| Weight | Frequency |
| 40 - 45 | 5 |
| 45 - 50 | 17 |
| 50 - 55 | 22 |
| 55 - 60 | 45 |
| 60 - 65 | 51 |
| 65 - 70 | 31 |
| 70 - 75 | 20 |
| 75 - 80 | 9 |
Use your ogive to estimate the following:
(i) The percentage of students weighing 55kg or more.
(ii) The weight above which the heaviest 30% of the students fall.
(iii) The number of students who are:
(1) under-weight and
(2) over-weight, if 55·70 kg is considered as standard weight.
Cumulative frequency curve is also called ______.
