Advertisements
Advertisements
प्रश्न
The daily wages of 80 workers in a project are given below.
| Wages (in Rs.) |
400-450 | 450-500 | 500-550 | 550-600 | 600-650 | 650-700 | 700-750 |
| No. of workers |
2 | 6 | 12 | 18 | 24 | 13 | 5 |
Use a graph paper to draw an ogive for the above distribution. (Use a scale of 2 cm = Rs. 50 on x-axis and 2 cm = 10 workers on y-axis). Use your ogive to estimate:
- the median wage of the workers.
- the lower quartile wage of workers.
- the numbers of workers who earn more than Rs. 625 daily.
Advertisements
उत्तर
The cumulative frequency table of the given distribution is as follows:
| Wages (in Rs.) | Upper limit | No. of workers | Cumulative frequency |
| 400-450 | 450 | 2 | 2 |
| 450-500 | 500 | 6 | 8 |
| 500-550 | 550 | 12 | 20 |
| 550-600 | 600 | 18 | 38 |
| 600-650 | 650 | 24 | 62 |
| 650-700 | 700 | 13 | 75 |
| 700-750 | 750 | 5 | 80 |
The ogive is as follows:
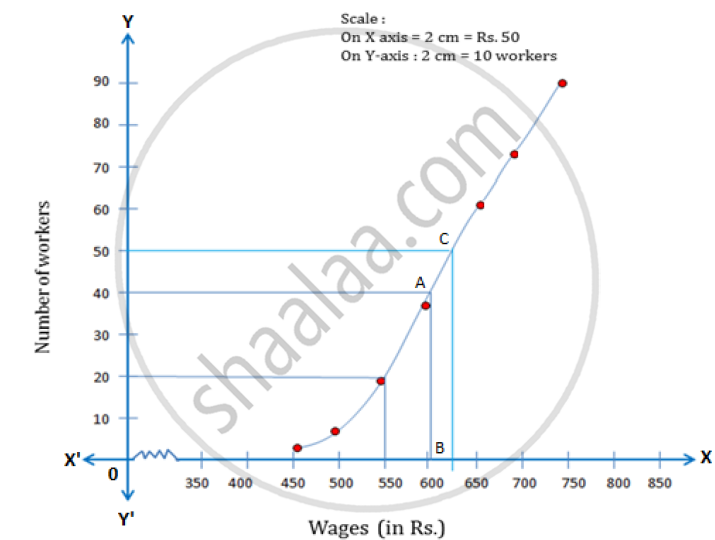
Number of workers = n = 80
i. Median = `(n/2)^"th"` term = 40th term
Through mark 40 on the Y-axis, draw a horizontal line which meets the curve at point A.
Through point A, on the curve draw a vertical line which meets the X-axis at point B
The value of point B on the X-axis is the median, which is 605.
ii. Lower quartile (Q1) = `(80/4)^"th"` term = 20th term = 550
iii. Through mark of 625 on X-axis, draw a verticle line which meets the graph at point C.
Then through point C, draw a horizontal line which meets the Y-axis at the mark of 50.
Thus, the number of workers that earn more than Rs. 625 daily = 80 – 50 = 30.
APPEARS IN
संबंधित प्रश्न
The weight of 50 workers is given below:
| Weight in Kg | 50-60 | 60-70 | 70-80 | 80-90 | 90-100 | 100-110 | 110-120 |
| No. of Workers | 4 | 7 | 11 | 14 | 6 | 5 | 3 |
Draw an ogive of the given distribution using a graph sheet. Take 2 cm = 10 kg on one axis and 2 cm = 5 workers along the other axis. Use a graph to estimate the following:
1) The upper and lower quartiles.
2) If weighing 95 kg and above is considered overweight, find the number of workers who are overweight.
The marks scored by 750 students in an examination are given in the form of a frequency distribution table:
| Marks | No. of students |
| 600 - 640 | 16 |
| 640 - 680 | 45 |
| 680 - 720 | 156 |
| 720 - 760 | 284 |
| 760 - 800 | 172 |
| 800 - 840 | 59 |
| 840 - 880 | 18 |
The annual profits earned by 30 shops of a shopping complex in a locality give rise to the following distribution:
| Profit (in lakhs in Rs) | Number of shops (frequency) |
| More than or equal to 5 More than or equal to 10 More than or equal to 15 More than or equal to 20 More than or equal to 25 More than or equal to 30 More than or equal to 35 |
30 28 16 14 10 7 3 |
Draw both ogives for the above data and hence obtain the median.
Draw a cumulative frequency curve (ogive) for the following distributions:
| Class Interval | 10 – 19 | 20 – 29 | 30 – 39 | 40 – 49 | 50 – 59 |
| Frequency | 23 | 16 | 15 | 20 | 12 |
Draw an ogive for the following distributions:
| Marks obtained | less than 10 | less than 20 | less than 30 | less than 40 | less than 50 |
| No. of students | 8 | 25 | 38 | 50 | 67 |
Draw an ogive for the following distributions:
| Age in years (less than) | 10 | 20 | 30 | 40 | 50 | 60 | 70 |
| Cumulative frequency | 0 | 17 | 32 | 37 | 53 | 58 | 65 |
Construct a frequency distribution table for the following distributions:
| Marks (less than) | 0 | 10 | 20 | 30 | 40 | 50 | 60 | 70 | 80 | 90 | 100 |
| Cumulative frequency | 0 | 7 | 28 | 54 | 71 | 84 | 105 | 147 | 180 | 196 | 200 |
Draw an ogive for the following :
| Class Interval | 10-19 | 20-29 | 30-39 | 40-49 | 50-59 |
| Frequency | 28 | 23 | 15 | 20 | 14 |
Using a graph paper, drawn an Ogive for the following distribution which shows a record of the weight in kilograms of 200 students.
| Weight | Frequency |
| 40 - 45 | 5 |
| 45 - 50 | 17 |
| 50 - 55 | 22 |
| 55 - 60 | 45 |
| 60 - 65 | 51 |
| 65 - 70 | 31 |
| 70 - 75 | 20 |
| 75 - 80 | 9 |
Use your ogive to estimate the following:
(i) The percentage of students weighing 55kg or more.
(ii) The weight above which the heaviest 30% of the students fall.
(iii) The number of students who are:
(1) under-weight and
(2) over-weight, if 55·70 kg is considered as standard weight.
Use graph paper for this question. The following table shows the weights in gm of a sample of 100 potatoes taken from a large consignment:
| Weight (gms) | Frequency |
| 50 - 60 | 8 |
| 60 - 70 | 10 |
| 70 - 80 | 12 |
| 80 - 90 | 16 |
| 90 - 100 | 18 |
| 100 - 110 | 14 |
| 110 - 120 | 12 |
| 120 - 130 | 10 |
(i) Calculate the cumulative frequencies.
(ii) Draw the cumulative frequency curve and form it determine the median weights of the potatoes.
