Advertisements
Advertisements
प्रश्न
Draw an ogive for the following distributions:
| Marks obtained | less than 10 | less than 20 | less than 30 | less than 40 | less than 50 |
| No. of students | 8 | 25 | 38 | 50 | 67 |
Advertisements
उत्तर
| Marks Obtained | No. of students (c.f.) |
| less than 10 | 8 |
| less than 20 | 25 |
| less than 30 | 38 |
| less than 40 | 50 |
| less than 50 | 67 |
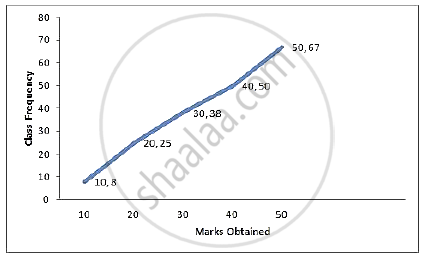
Steps of construction:
- Plot the points (10, 8), (20, 25), (30, 38), (40, 50) and (50, 67) on the graph.
- Join them with free hand to obtain an ogive.
APPEARS IN
संबंधित प्रश्न
The weight of 50 workers is given below:
| Weight in Kg | 50-60 | 60-70 | 70-80 | 80-90 | 90-100 | 100-110 | 110-120 |
| No. of Workers | 4 | 7 | 11 | 14 | 6 | 5 | 3 |
Draw an ogive of the given distribution using a graph sheet. Take 2 cm = 10 kg on one axis and 2 cm = 5 workers along the other axis. Use a graph to estimate the following:
1) The upper and lower quartiles.
2) If weighing 95 kg and above is considered overweight, find the number of workers who are overweight.
Draw an ogive to represent the following frequency distribution:
| Class-interval: | 0 - 4 | 5 - 9 | 10 - 14 | 15 - 19 | 20 - 24 |
| Frequency: | 2 | 6 | 10 | 5 | 3 |
The following table gives production yield per hectare of wheat of 100 farms of a village:
| Production yield in kg per hectare: | 50 - 55 | 55 - 60 | 60 - 65 | 65 - 70 | 70 - 75 | 75 - 80 |
| Number of farms: | 2 | 8 | 12 | 24 | 38 | 16 |
Draw ‘less than’ ogive and ‘more than’ ogive.
Draw an ogive for the following distributions:
| Age in years (less than) | 10 | 20 | 30 | 40 | 50 | 60 | 70 |
| Cumulative frequency | 0 | 17 | 32 | 37 | 53 | 58 | 65 |
Construct a frequency distribution table for the following distributions:
| Marks (less than) | 0 | 10 | 20 | 30 | 40 | 50 | 60 | 70 | 80 | 90 | 100 |
| Cumulative frequency | 0 | 7 | 28 | 54 | 71 | 84 | 105 | 147 | 180 | 196 | 200 |
Construct a frequency distribution table for the following distributions:
| Marks (more than) | 0 | 10 | 20 | 30 | 40 | 50 | 60 | 70 | 80 | 90 | 100 |
| Cumulative frequency | 100 | 87 | 65 | 55 | 42 | 36 | 31 | 21 | 18 | 7 | 0 |
Find the correct answer from the alternatives given.
Cumulative frequencies in a grouped frequency table are useful to find ______.
Draw an ogive for the following :
| Class Interval | 0-10 | 10-20 | 20-30 | 30-40 | 40-50 |
| Frequency | 8 | 12 | 10 | 14 | 6 |
Draw an ogive for the following :
| Marks (More than) | 0 | 10 | 20 | 30 | 40 | 50 | 60 | 70 | 80 | 90 | 100 |
| Cumulative Frequency | 100 | 87 | 65 | 55 | 42 | 36 | 31 | 21 | 18 | 7 | 0 |
Using a graph paper, drawn an Ogive for the following distribution which shows a record of the weight in kilograms of 200 students.
| Weight | Frequency |
| 40 - 45 | 5 |
| 45 - 50 | 17 |
| 50 - 55 | 22 |
| 55 - 60 | 45 |
| 60 - 65 | 51 |
| 65 - 70 | 31 |
| 70 - 75 | 20 |
| 75 - 80 | 9 |
Use your ogive to estimate the following:
(i) The percentage of students weighing 55kg or more.
(ii) The weight above which the heaviest 30% of the students fall.
(iii) The number of students who are:
(1) under-weight and
(2) over-weight, if 55·70 kg is considered as standard weight.
