Advertisements
Advertisements
प्रश्न
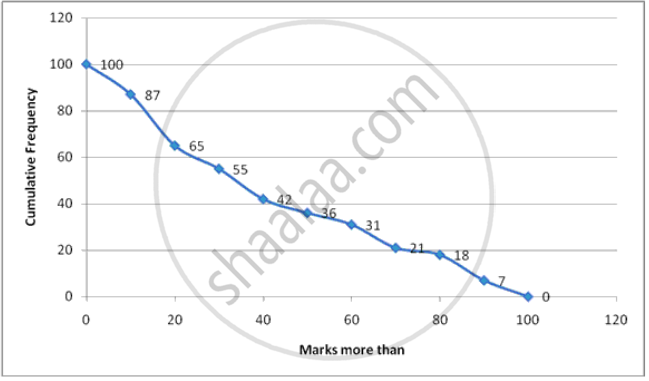
Draw an ogive for the following :
| Marks (More than) | 0 | 10 | 20 | 30 | 40 | 50 | 60 | 70 | 80 | 90 | 100 |
| Cumulative Frequency | 100 | 87 | 65 | 55 | 42 | 36 | 31 | 21 | 18 | 7 | 0 |
Advertisements
उत्तर
Steps :
1. Start with lower limits of class intervals and from cumulative frequency , subtract the frequency of each class to obtain c.f distribution .
2. Mark lower class limits along x-axis . 1 cm = 5 units
3. Mark cumulative frequencies along y-axis. 1 cm = 5 units
4. Plot points (x,f) where x is the lower limit of one class and f is the corresponding c.f. (0,100),(10,87),(20,65),(30,55),(40,42),(50,36),(60,31),(70,21),(80,18),(90,7),(100,0)
5. Join the points to get the ogive.
| Marks more than | Cumulative Frequency |
| 0 | 100 |
| 10 | 87 |
| 20 | 65 |
| 30 | 55 |
| 40 | 42 |
| 50 | 36 |
| 60 | 31 |
| 70 | 21 |
| 80 | 18 |
| 90 | 7 |
| 100 | 0 |
APPEARS IN
संबंधित प्रश्न
The weight of 50 workers is given below:
| Weight in Kg | 50-60 | 60-70 | 70-80 | 80-90 | 90-100 | 100-110 | 110-120 |
| No. of Workers | 4 | 7 | 11 | 14 | 6 | 5 | 3 |
Draw an ogive of the given distribution using a graph sheet. Take 2 cm = 10 kg on one axis and 2 cm = 5 workers along the other axis. Use a graph to estimate the following:
1) The upper and lower quartiles.
2) If weighing 95 kg and above is considered overweight, find the number of workers who are overweight.
The marks scored by 750 students in an examination are given in the form of a frequency distribution table:
| Marks | No. of students |
| 600 - 640 | 16 |
| 640 - 680 | 45 |
| 680 - 720 | 156 |
| 720 - 760 | 284 |
| 760 - 800 | 172 |
| 800 - 840 | 59 |
| 840 - 880 | 18 |
Draw an ogive to represent the following frequency distribution:
| Class-interval: | 0 - 4 | 5 - 9 | 10 - 14 | 15 - 19 | 20 - 24 |
| Frequency: | 2 | 6 | 10 | 5 | 3 |
Draw a cumulative frequency curve (ogive) for the following distributions:
| Class Interval | 10 – 19 | 20 – 29 | 30 – 39 | 40 – 49 | 50 – 59 |
| Frequency | 23 | 16 | 15 | 20 | 12 |
Draw an ogive for the following distributions:
| Marks obtained | less than 10 | less than 20 | less than 30 | less than 40 | less than 50 |
| No. of students | 8 | 25 | 38 | 50 | 67 |
Construct a frequency distribution table for the following distributions:
| Marks (less than) | 0 | 10 | 20 | 30 | 40 | 50 | 60 | 70 | 80 | 90 | 100 |
| Cumulative frequency | 0 | 7 | 28 | 54 | 71 | 84 | 105 | 147 | 180 | 196 | 200 |
Construct a frequency distribution table for the following distributions:
| Marks (more than) | 0 | 10 | 20 | 30 | 40 | 50 | 60 | 70 | 80 | 90 | 100 |
| Cumulative frequency | 100 | 87 | 65 | 55 | 42 | 36 | 31 | 21 | 18 | 7 | 0 |
Find the correct answer from the alternatives given.
Cumulative frequencies in a grouped frequency table are useful to find ______.
Draw an ogive for the following :
| Marks obtained | More than 10 | More than 20 | More than 30 | More than 40 | More than 50 |
| No. of students | 8 | 25 | 38 | 50 | 67 |
The following is the frequency distribution with unknown frequencies :
| Class | 60-70 | 70-80 | 80-90 | 90-100 | Total |
| frequency | `"a"/2` | `(3"a")/2` | 2a | a | 50 |
Find the value of a, hence find the frequencies. Draw a histogram and frequency polygon on the same coordinate system.
