Advertisements
Advertisements
प्रश्न
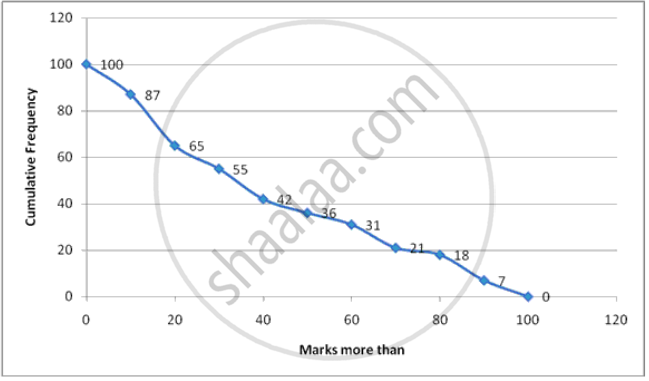
Draw an ogive for the following :
| Marks (More than) | 0 | 10 | 20 | 30 | 40 | 50 | 60 | 70 | 80 | 90 | 100 |
| Cumulative Frequency | 100 | 87 | 65 | 55 | 42 | 36 | 31 | 21 | 18 | 7 | 0 |
Advertisements
उत्तर
Steps :
1. Start with lower limits of class intervals and from cumulative frequency , subtract the frequency of each class to obtain c.f distribution .
2. Mark lower class limits along x-axis . 1 cm = 5 units
3. Mark cumulative frequencies along y-axis. 1 cm = 5 units
4. Plot points (x,f) where x is the lower limit of one class and f is the corresponding c.f. (0,100),(10,87),(20,65),(30,55),(40,42),(50,36),(60,31),(70,21),(80,18),(90,7),(100,0)
5. Join the points to get the ogive.
| Marks more than | Cumulative Frequency |
| 0 | 100 |
| 10 | 87 |
| 20 | 65 |
| 30 | 55 |
| 40 | 42 |
| 50 | 36 |
| 60 | 31 |
| 70 | 21 |
| 80 | 18 |
| 90 | 7 |
| 100 | 0 |
APPEARS IN
संबंधित प्रश्न
The annual profits earned by 30 shops of a shopping complex in a locality give rise to the following distribution:
| Profit (in lakhs in Rs) | Number of shops (frequency) |
| More than or equal to 5 More than or equal to 10 More than or equal to 15 More than or equal to 20 More than or equal to 25 More than or equal to 30 More than or equal to 35 |
30 28 16 14 10 7 3 |
Draw both ogives for the above data and hence obtain the median.
Draw a cumulative frequency curve (ogive) for the following distributions:
| Class Interval | 10 – 19 | 20 – 29 | 30 – 39 | 40 – 49 | 50 – 59 |
| Frequency | 23 | 16 | 15 | 20 | 12 |
Draw an ogive for the following distributions:
| Marks obtained | less than 10 | less than 20 | less than 30 | less than 40 | less than 50 |
| No. of students | 8 | 25 | 38 | 50 | 67 |
Construct a frequency distribution table for the following distributions:
| Marks (less than) | 0 | 10 | 20 | 30 | 40 | 50 | 60 | 70 | 80 | 90 | 100 |
| Cumulative frequency | 0 | 7 | 28 | 54 | 71 | 84 | 105 | 147 | 180 | 196 | 200 |
Draw an ogive for the following :
| Class Interval | 0-10 | 10-20 | 20-30 | 30-40 | 40-50 |
| Frequency | 8 | 12 | 10 | 14 | 6 |
Draw an ogive for the following:
| Marks obtained | Less than 10 | Less than 20 | Less than 30 | Less than 40 | Less than 50 |
| No. of students | 8 | 22 | 48 | 60 | 75 |
Draw an ogive for the following :
| Age in years | Less than 10 | Less than 20 | Less than 30 | Less than 40 | Less than 50 |
| No. of people | 0 | 17 | 42 | 67 | 100 |
Using a graph paper, drawn an Ogive for the following distribution which shows a record of the weight in kilograms of 200 students.
| Weight | Frequency |
| 40 - 45 | 5 |
| 45 - 50 | 17 |
| 50 - 55 | 22 |
| 55 - 60 | 45 |
| 60 - 65 | 51 |
| 65 - 70 | 31 |
| 70 - 75 | 20 |
| 75 - 80 | 9 |
Use your ogive to estimate the following:
(i) The percentage of students weighing 55kg or more.
(ii) The weight above which the heaviest 30% of the students fall.
(iii) The number of students who are:
(1) under-weight and
(2) over-weight, if 55·70 kg is considered as standard weight.
Use graph paper for this question. The following table shows the weights in gm of a sample of 100 potatoes taken from a large consignment:
| Weight (gms) | Frequency |
| 50 - 60 | 8 |
| 60 - 70 | 10 |
| 70 - 80 | 12 |
| 80 - 90 | 16 |
| 90 - 100 | 18 |
| 100 - 110 | 14 |
| 110 - 120 | 12 |
| 120 - 130 | 10 |
(i) Calculate the cumulative frequencies.
(ii) Draw the cumulative frequency curve and form it determine the median weights of the potatoes.
Cumulative frequency curve is also called ______.
