Advertisements
Advertisements
प्रश्न
The annual profits earned by 30 shops of a shopping complex in a locality give rise to the following distribution:
| Profit (in lakhs in Rs) | Number of shops (frequency) |
| More than or equal to 5 More than or equal to 10 More than or equal to 15 More than or equal to 20 More than or equal to 25 More than or equal to 30 More than or equal to 35 |
30 28 16 14 10 7 3 |
Draw both ogives for the above data and hence obtain the median.
Advertisements
उत्तर
Firstly, we prepare the cumulative frequency table for less than type.
Profit (In lakh in Rs.) |
No. of shops (frequency) |
Profit (less than) |
Cumulative frequency |
Suitable points |
| 5-10 | 2 | 10 | 2 | (10, 2) |
| 10-15 | 12 | 15 | 14 | (15, 14) |
| 15-20 | 2 | 20 | 16 | (20, 16) |
| 20-25 | 4 | 25 | 20 | (25, 20) |
| 25-30 | 3 | 30 | 23 | (30, 23) |
| 30-35 | 4 | 35 | 27 | (35, 27) |
| 35-40 | 3 | 40 | 30 | (40, 30) |
Again, prepare the cumulative frequency table for more than type.
Profit (In lakh in Rs.) |
No. of shops (frequency) |
Profit (more than) |
Cumulative |
Suitable |
| 5-10 | 2 | 5 | 30 | (5, 30) |
| 10-15 | 12 | 10 | 28 | (10, 28) |
| 15-20 | 2 | 15 | 16 | (15, 16) |
| 20-25 | 4 | 20 | 14 | (20, 14) |
| 25-30 | 3 | 25 | 10 | (25, 10) |
| 30-35 | 4 | 30 | 7 | (30, 7) |
| 35-40 | 3 | 35 | 3 | (35, 3) |
Now, “more than ogive” and “less than ogive” can be drawn as follows:
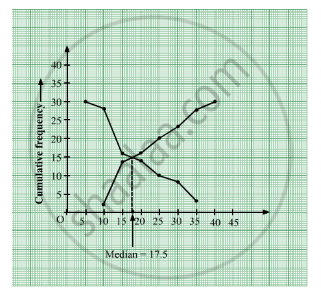
The x-coordinate of the point of intersection of the “more-than ogive” and “less-than ogive” gives the median of the given distribution..
So, the corresponding median is Rs 17.5 lakh.
shaalaa.com
क्या इस प्रश्न या उत्तर में कोई त्रुटि है?
