Advertisements
Advertisements
Question
Draw an ogive for the following distributions:
| Marks obtained | less than 10 | less than 20 | less than 30 | less than 40 | less than 50 |
| No. of students | 8 | 25 | 38 | 50 | 67 |
Advertisements
Solution
| Marks Obtained | No. of students (c.f.) |
| less than 10 | 8 |
| less than 20 | 25 |
| less than 30 | 38 |
| less than 40 | 50 |
| less than 50 | 67 |
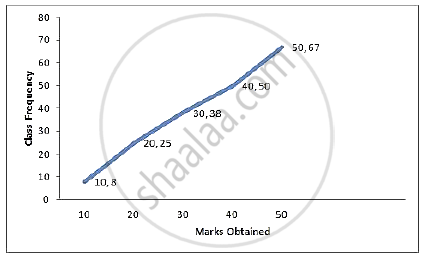
Steps of construction:
- Plot the points (10, 8), (20, 25), (30, 38), (40, 50) and (50, 67) on the graph.
- Join them with free hand to obtain an ogive.
APPEARS IN
RELATED QUESTIONS
Draw an ogive by less than method for the following data:
| No. of rooms: | 1 | 2 | 3 | 4 | 5 | 6 | 7 | 8 | 9 | 10 |
| No. of houses: | 4 | 9 | 22 | 28 | 24 | 12 | 8 | 6 | 5 | 2 |
Draw an ogive to represent the following frequency distribution:
| Class-interval: | 0 - 4 | 5 - 9 | 10 - 14 | 15 - 19 | 20 - 24 |
| Frequency: | 2 | 6 | 10 | 5 | 3 |
The annual profits earned by 30 shops of a shopping complex in a locality give rise to the following distribution:
| Profit (in lakhs in Rs) | Number of shops (frequency) |
| More than or equal to 5 More than or equal to 10 More than or equal to 15 More than or equal to 20 More than or equal to 25 More than or equal to 30 More than or equal to 35 |
30 28 16 14 10 7 3 |
Draw both ogives for the above data and hence obtain the median.
Construct a frequency distribution table for the following distributions:
| Marks (less than) | 0 | 10 | 20 | 30 | 40 | 50 | 60 | 70 | 80 | 90 | 100 |
| Cumulative frequency | 0 | 7 | 28 | 54 | 71 | 84 | 105 | 147 | 180 | 196 | 200 |
Draw an ogive for the following :
| Class Interval | 0-10 | 10-20 | 20-30 | 30-40 | 40-50 |
| Frequency | 8 | 12 | 10 | 14 | 6 |
Draw an ogive for the following :
| Age in years | Less than 10 | Less than 20 | Less than 30 | Less than 40 | Less than 50 |
| No. of people | 0 | 17 | 42 | 67 | 100 |
Find the width of class 35 - 45.
The following is the frequency distribution with unknown frequencies :
| Class | 60-70 | 70-80 | 80-90 | 90-100 | Total |
| frequency | `"a"/2` | `(3"a")/2` | 2a | a | 50 |
Find the value of a, hence find the frequencies. Draw a histogram and frequency polygon on the same coordinate system.
The frequency distribution of scores obtained by 230 candidates in a medical entrance test is as ahead:
| Cost of living Index | Number of Months |
| 400 - 450 | 20 |
| 450 - 500 | 35 |
| 500 - 550 | 40 |
| 550 - 600 | 32 |
| 600 - 650 | 24 |
| 650 - 700 | 27 |
| 700 - 750 | 18 |
| 750 - 800 | 34 |
| Total | 230 |
Draw a cummulative polygon (ogive) to represent the above data.
Use graph paper for this question. The following table shows the weights in gm of a sample of 100 potatoes taken from a large consignment:
| Weight (gms) | Frequency |
| 50 - 60 | 8 |
| 60 - 70 | 10 |
| 70 - 80 | 12 |
| 80 - 90 | 16 |
| 90 - 100 | 18 |
| 100 - 110 | 14 |
| 110 - 120 | 12 |
| 120 - 130 | 10 |
(i) Calculate the cumulative frequencies.
(ii) Draw the cumulative frequency curve and form it determine the median weights of the potatoes.
