Advertisements
Advertisements
Question
The frequency distribution of scores obtained by 230 candidates in a medical entrance test is as ahead:
| Cost of living Index | Number of Months |
| 400 - 450 | 20 |
| 450 - 500 | 35 |
| 500 - 550 | 40 |
| 550 - 600 | 32 |
| 600 - 650 | 24 |
| 650 - 700 | 27 |
| 700 - 750 | 18 |
| 750 - 800 | 34 |
| Total | 230 |
Draw a cummulative polygon (ogive) to represent the above data.
Advertisements
Solution
The cummulative frequency table for the given frequency table as given below:
| Interval (Score) |
Frequency | Cummulative Frequency |
| 400 - 450 | 20 | 20 |
| 450 - 500 | 35 | 55 |
| 500 - 550 | 40 | 95 |
| 550 - 600 | 32 | 127 |
| 600 - 650 | 24 | 151 |
| 650 - 700 | 27 | 178 |
| 700 - 750 | 18 | 196 |
| 750 - 800 | 34 | 230 |
Ogive representing the scores obtained by 230 candidates in a medical entrance test.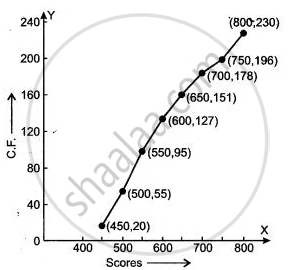
RELATED QUESTIONS
The daily wages of 80 workers in a project are given below.
| Wages (in Rs.) |
400-450 | 450-500 | 500-550 | 550-600 | 600-650 | 650-700 | 700-750 |
| No. of workers |
2 | 6 | 12 | 18 | 24 | 13 | 5 |
Use a graph paper to draw an ogive for the above distribution. (Use a scale of 2 cm = Rs. 50 on x-axis and 2 cm = 10 workers on y-axis). Use your ogive to estimate:
- the median wage of the workers.
- the lower quartile wage of workers.
- the numbers of workers who earn more than Rs. 625 daily.
The marks obtained by 100 students in a Mathematics test are given below:
| Marks | 0-10 | 10-20 | 20-30 | 30-40 | 40-50 | 50-60 | 60-70 | 70-80 | 80-90 | 90-100 |
| No. of students |
3 | 7 | 12 | 17 | 23 | 14 | 9 | 6 | 5 | 4 |
Draw an ogive for the given distribution on a graph sheet.
Use a scale of 2 cm = 10 units on both axes.
Use the ogive to estimate the:
1) Median.
2) Lower quartile.
3) A number of students who obtained more than 85% marks in the test.
4) A number of students who did not pass in the test if the pass percentage was 35.
The marks scored by 750 students in an examination are given in the form of a frequency distribution table:
| Marks | No. of students |
| 600 - 640 | 16 |
| 640 - 680 | 45 |
| 680 - 720 | 156 |
| 720 - 760 | 284 |
| 760 - 800 | 172 |
| 800 - 840 | 59 |
| 840 - 880 | 18 |
Draw a cumulative frequency curve (ogive) for the following distributions:
| Class Interval | 10 – 19 | 20 – 29 | 30 – 39 | 40 – 49 | 50 – 59 |
| Frequency | 23 | 16 | 15 | 20 | 12 |
Construct a frequency distribution table for the following distributions:
| Marks (less than) | 0 | 10 | 20 | 30 | 40 | 50 | 60 | 70 | 80 | 90 | 100 |
| Cumulative frequency | 0 | 7 | 28 | 54 | 71 | 84 | 105 | 147 | 180 | 196 | 200 |
Construct a frequency distribution table for the following distributions:
| Marks (more than) | 0 | 10 | 20 | 30 | 40 | 50 | 60 | 70 | 80 | 90 | 100 |
| Cumulative frequency | 100 | 87 | 65 | 55 | 42 | 36 | 31 | 21 | 18 | 7 | 0 |
Draw an ogive for the following :
| Class Interval | 100-150 | 150-200 | 200-250 | 250-300 | 300-350 | 350-400 |
| Frequency | 10 | 13 | 17 | 12 | 10 | 8 |
Draw an ogive for the following:
| Marks obtained | Less than 10 | Less than 20 | Less than 30 | Less than 40 | Less than 50 |
| No. of students | 8 | 22 | 48 | 60 | 75 |
Use graph paper for this question. The following table shows the weights in gm of a sample of 100 potatoes taken from a large consignment:
| Weight (gms) | Frequency |
| 50 - 60 | 8 |
| 60 - 70 | 10 |
| 70 - 80 | 12 |
| 80 - 90 | 16 |
| 90 - 100 | 18 |
| 100 - 110 | 14 |
| 110 - 120 | 12 |
| 120 - 130 | 10 |
(i) Calculate the cumulative frequencies.
(ii) Draw the cumulative frequency curve and form it determine the median weights of the potatoes.
Cumulative frequency curve is also called ______.
