Advertisements
Advertisements
प्रश्न
Use Graph paper for this question.
A survey regarding height (in cm) of 60 boys belonging to Class 10 of a school was conducted. The following data was recorded:
| Height in cm |
135 – 140 | 140 – 145 | 145 – 150 | 150 – 155 | 155 – 160 | 160 – 165 | 165 – 170 |
| No. of boys |
4 | 8 | 20 | 14 | 7 | 6 | 1 |
Taking 2 cm = height of 10 cm along one axis and 2 cm = 10 boys along the other axis draw an ogive of the above distribution. Use the graph to estimate the following:
- the median
- lower quartile
- if above 158 cm is considered as the tall boys of the class. Find the number of boys in the class who are tall.
आलेख
Advertisements
उत्तर
| Height in cm | No. of Boys | c.f. |
| 135 – 140 | 4 | 4 |
| 140 – 145 | 8 | 12 |
| 145 – 150 | 20 | 32 |
| 150 – 155 | 14 | 46 |
| 155 – 160 | 7 | 53 |
| 160 – 165 | 6 | 59 |
| 165 – 170 | 1 | 60 |
| n = 60 |
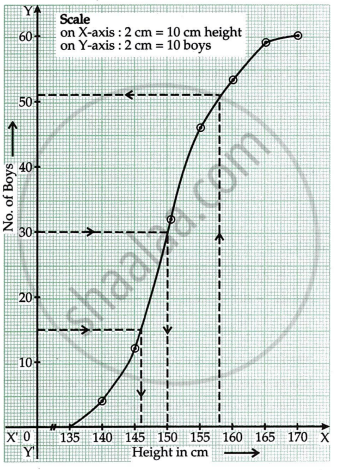
i. Median = `n/2`th observation
= `60/2`th observation
= 30th observation
= 150 cm (From ogive)
ii. Lower quartile = `n/4`th observation
= `60/4`th observation
= 15th observation
= 146 cm (From ogive)
iii. No. of boys whose height is less than 158 cm = 51. (From ogive)
∴ No. of tall boys = 60 – 51 = 9.
shaalaa.com
क्या इस प्रश्न या उत्तर में कोई त्रुटि है?
