Advertisements
Advertisements
प्रश्न
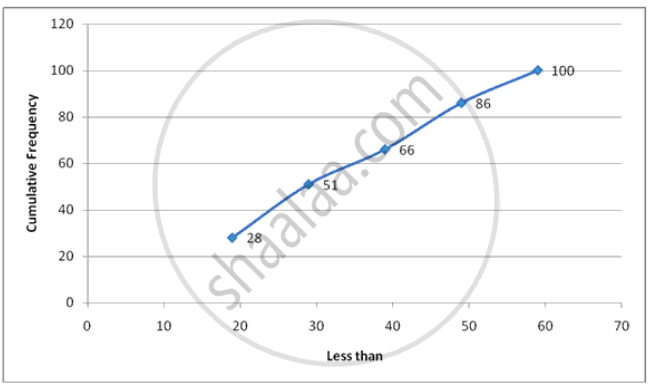
Draw an ogive for the following :
| Class Interval | 10-19 | 20-29 | 30-39 | 40-49 | 50-59 |
| Frequency | 28 | 23 | 15 | 20 | 14 |
Advertisements
उत्तर
Steps :
1. On the x-axis , take 1 cm as 5 units and plot class interval.
2. On the y-axis , take 1 cm as 5 units and plot frequency.
3. Plot the points with coordinates having abscissae as actual limits and ordinates as the cumulative frequencies . In this case (19,28),(29,51),(39,66),(49,86),(59,100).
4. Join the points plotted by a smooth curve .
| less than | Cumulative Frequency |
| 19 | 28 |
| 29 | 51 |
| 39 | 66 |
| 49 | 86 |
| 59 | 100 |
APPEARS IN
संबंधित प्रश्न
The marks obtained by 100 students in a Mathematics test are given below:
| Marks | 0-10 | 10-20 | 20-30 | 30-40 | 40-50 | 50-60 | 60-70 | 70-80 | 80-90 | 90-100 |
| No. of students |
3 | 7 | 12 | 17 | 23 | 14 | 9 | 6 | 5 | 4 |
Draw an ogive for the given distribution on a graph sheet.
Use a scale of 2 cm = 10 units on both axes.
Use the ogive to estimate the:
1) Median.
2) Lower quartile.
3) A number of students who obtained more than 85% marks in the test.
4) A number of students who did not pass in the test if the pass percentage was 35.
The marks scored by 750 students in an examination are given in the form of a frequency distribution table:
| Marks | No. of students |
| 600 - 640 | 16 |
| 640 - 680 | 45 |
| 680 - 720 | 156 |
| 720 - 760 | 284 |
| 760 - 800 | 172 |
| 800 - 840 | 59 |
| 840 - 880 | 18 |
The following table gives the height of trees:
| Height | No. of trees |
| Less than 7 Less than 14 Less than 21 Less than 28 Less than 35 Less than 42 Less than 49 Less than 56 |
26 57 92 134 216 287 341 360 |
Draw 'less than' ogive and 'more than' ogive.
Draw an ogive for the following distributions:
| Age in years (less than) | 10 | 20 | 30 | 40 | 50 | 60 | 70 |
| Cumulative frequency | 0 | 17 | 32 | 37 | 53 | 58 | 65 |
Construct a frequency distribution table for the following distributions:
| Marks (less than) | 0 | 10 | 20 | 30 | 40 | 50 | 60 | 70 | 80 | 90 | 100 |
| Cumulative frequency | 0 | 7 | 28 | 54 | 71 | 84 | 105 | 147 | 180 | 196 | 200 |
Construct a frequency distribution table for the following distributions:
| Marks (more than) | 0 | 10 | 20 | 30 | 40 | 50 | 60 | 70 | 80 | 90 | 100 |
| Cumulative frequency | 100 | 87 | 65 | 55 | 42 | 36 | 31 | 21 | 18 | 7 | 0 |
Find the correct answer from the alternatives given.
Cumulative frequencies in a grouped frequency table are useful to find ______.
The marks obtained by 100 students of a class in an examination are given below.
| Marks | No. of students |
| 0-5 | 2 |
| 5-10 | 5 |
| 10-15 | 6 |
| 15-20 | 8 |
| 20-25 | 10 |
| 25-30 | 25 |
| 30-35 | 20 |
| 35-40 | 18 |
| 40-45 | 4 |
| 45-50 | 2 |
Draw 'a less than' type cumulative frequency curves (orgive). Hence find median
Find the width of class 35 - 45.
Using a graph paper, drawn an Ogive for the following distribution which shows a record of the weight in kilograms of 200 students.
| Weight | Frequency |
| 40 - 45 | 5 |
| 45 - 50 | 17 |
| 50 - 55 | 22 |
| 55 - 60 | 45 |
| 60 - 65 | 51 |
| 65 - 70 | 31 |
| 70 - 75 | 20 |
| 75 - 80 | 9 |
Use your ogive to estimate the following:
(i) The percentage of students weighing 55kg or more.
(ii) The weight above which the heaviest 30% of the students fall.
(iii) The number of students who are:
(1) under-weight and
(2) over-weight, if 55·70 kg is considered as standard weight.
