Advertisements
Advertisements
प्रश्न
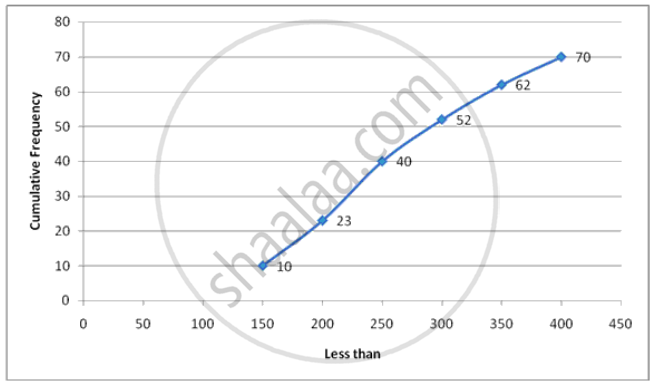
Draw an ogive for the following :
| Class Interval | 100-150 | 150-200 | 200-250 | 250-300 | 300-350 | 350-400 |
| Frequency | 10 | 13 | 17 | 12 | 10 | 8 |
Advertisements
उत्तर
Steps :
1. On the x-axis , take 1 cm as 5 units and plot class interval.
2. On the y-axis , take 1 cm as 5 units and plot frequency.
3. plot the points with coordinates having abscissae as actual limits and ordinates as the cumulative frequencies . In this case (150,10),(200,23),(250,40)(300,52)(350,62),(400,70).
4. Join the points plotted by a smooth curve.
| less than | Cumulative Frequency |
| 150 | 10 |
| 200 | 23 |
| 250 | 40 |
| 300 | 52 |
| 350 | 62 |
| 400 | 70 |
APPEARS IN
संबंधित प्रश्न
The daily wages of 80 workers in a project are given below.
| Wages (in Rs.) |
400-450 | 450-500 | 500-550 | 550-600 | 600-650 | 650-700 | 700-750 |
| No. of workers |
2 | 6 | 12 | 18 | 24 | 13 | 5 |
Use a graph paper to draw an ogive for the above distribution. (Use a scale of 2 cm = Rs. 50 on x-axis and 2 cm = 10 workers on y-axis). Use your ogive to estimate:
- the median wage of the workers.
- the lower quartile wage of workers.
- the numbers of workers who earn more than Rs. 625 daily.
The marks obtained by 100 students in a Mathematics test are given below:
| Marks | 0-10 | 10-20 | 20-30 | 30-40 | 40-50 | 50-60 | 60-70 | 70-80 | 80-90 | 90-100 |
| No. of students |
3 | 7 | 12 | 17 | 23 | 14 | 9 | 6 | 5 | 4 |
Draw an ogive for the given distribution on a graph sheet.
Use a scale of 2 cm = 10 units on both axes.
Use the ogive to estimate the:
1) Median.
2) Lower quartile.
3) A number of students who obtained more than 85% marks in the test.
4) A number of students who did not pass in the test if the pass percentage was 35.
Draw an ogive by less than method for the following data:
| No. of rooms: | 1 | 2 | 3 | 4 | 5 | 6 | 7 | 8 | 9 | 10 |
| No. of houses: | 4 | 9 | 22 | 28 | 24 | 12 | 8 | 6 | 5 | 2 |
The annual profits earned by 30 shops of a shopping complex in a locality give rise to the following distribution:
| Profit (in lakhs in Rs) | Number of shops (frequency) |
| More than or equal to 5 More than or equal to 10 More than or equal to 15 More than or equal to 20 More than or equal to 25 More than or equal to 30 More than or equal to 35 |
30 28 16 14 10 7 3 |
Draw both ogives for the above data and hence obtain the median.
Draw a cumulative frequency curve (ogive) for the following distributions:
| Class Interval | 10 – 19 | 20 – 29 | 30 – 39 | 40 – 49 | 50 – 59 |
| Frequency | 23 | 16 | 15 | 20 | 12 |
Draw an ogive for the following :
| Class Interval | 0-10 | 10-20 | 20-30 | 30-40 | 40-50 |
| Frequency | 8 | 12 | 10 | 14 | 6 |
Draw an ogive for the following :
| Class Interval | 10-19 | 20-29 | 30-39 | 40-49 | 50-59 |
| Frequency | 28 | 23 | 15 | 20 | 14 |
Draw an ogive for the following:
| Marks obtained | Less than 10 | Less than 20 | Less than 30 | Less than 40 | Less than 50 |
| No. of students | 8 | 22 | 48 | 60 | 75 |
Draw an ogive for the following :
| Age in years | Less than 10 | Less than 20 | Less than 30 | Less than 40 | Less than 50 |
| No. of people | 0 | 17 | 42 | 67 | 100 |
Find the width of class 35 - 45.
