Advertisements
Advertisements
प्रश्न
The marks obtained by 100 students in a Mathematics test are given below:
| Marks | 0-10 | 10-20 | 20-30 | 30-40 | 40-50 | 50-60 | 60-70 | 70-80 | 80-90 | 90-100 |
| No. of students |
3 | 7 | 12 | 17 | 23 | 14 | 9 | 6 | 5 | 4 |
Draw an ogive for the given distribution on a graph sheet.
Use a scale of 2 cm = 10 units on both axes.
Use the ogive to estimate the:
1) Median.
2) Lower quartile.
3) A number of students who obtained more than 85% marks in the test.
4) A number of students who did not pass in the test if the pass percentage was 35.
Advertisements
उत्तर
Draw the cumulative frequency table.
| Marks | Number of Students (Frequency) | Cumulative Frequency |
| 0-10 | 3 | 3 |
| 10-20 | 7 | 10 |
| 20-30 | 12 | 22 |
| 30-40 | 17 | 39 |
| 40-50 | 23 | 62 |
| 50-60 | 14 | 76 |
| 60-70 | 9 | 85 |
| 70-80 | 6 | 91 |
| 80-90 | 5 | 96 |
| 90-100 | 4 | 100 |
Scale: On x-axis, 1 unit = 10 marks, On y-axis, 1 unit = 10 students
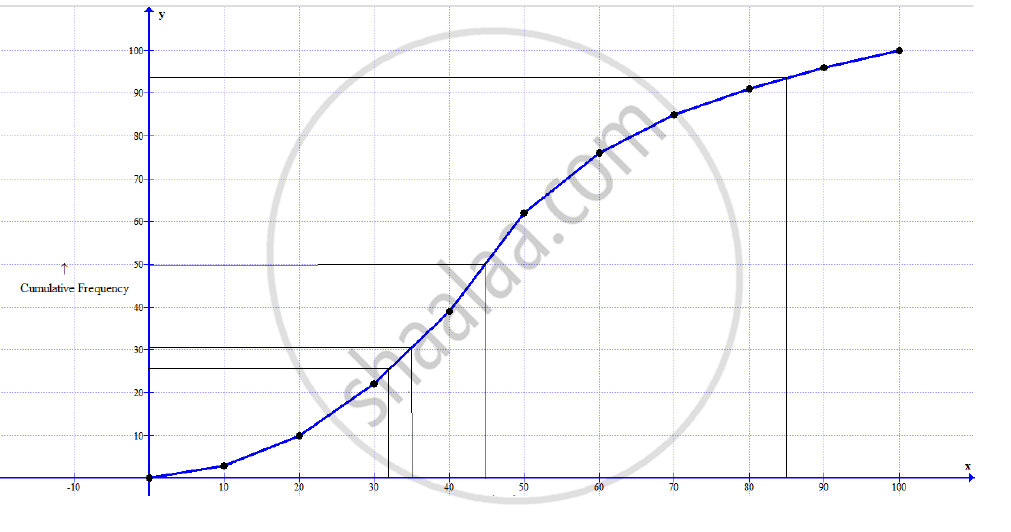
1) Median = `(N/2)^"th" term = (100/2)^"th" term = 50^"th term"`
Draw a horizontal line through mark 50 on the y-axis. The, draw a vertical line from the point it cuts on the graph. The point this line touches the x-axis is the median. Thus, median = 45
2) Lower quartile = `(N/4)^"th" term = (100/4)^"th" term = 25^"th term"`
Draw a horizontal line through mark 25 on the y-axis. The, draw a vertical line from the point it cuts on the graph. The point this line touches the x-axis is the lower quartile
Thus, lower quartile = 31
3) Draw a vertical line through mark 85 on the x-axis. Then, draw a horizontal line from the point it cuts on the graph.
The point where this line touches the y-axis is the number of students who obtained less than 85% marks =93
Thus, number of students who obtained more than 85% marks =100 – 93 = 7
4) Draw a vertical line through mark 35 on the x-axis. The, draw a horizontal line from the point it cuts on the graph.
The point where this line touches the y-axis is the number of students who obtained less than 35% marks = 21
APPEARS IN
संबंधित प्रश्न
The weight of 50 workers is given below:
| Weight in Kg | 50-60 | 60-70 | 70-80 | 80-90 | 90-100 | 100-110 | 110-120 |
| No. of Workers | 4 | 7 | 11 | 14 | 6 | 5 | 3 |
Draw an ogive of the given distribution using a graph sheet. Take 2 cm = 10 kg on one axis and 2 cm = 5 workers along the other axis. Use a graph to estimate the following:
1) The upper and lower quartiles.
2) If weighing 95 kg and above is considered overweight, find the number of workers who are overweight.
Draw an ogive by less than method for the following data:
| No. of rooms: | 1 | 2 | 3 | 4 | 5 | 6 | 7 | 8 | 9 | 10 |
| No. of houses: | 4 | 9 | 22 | 28 | 24 | 12 | 8 | 6 | 5 | 2 |
The annual profits earned by 30 shops of a shopping complex in a locality give rise to the following distribution:
| Profit (in lakhs in Rs) | Number of shops (frequency) |
| More than or equal to 5 More than or equal to 10 More than or equal to 15 More than or equal to 20 More than or equal to 25 More than or equal to 30 More than or equal to 35 |
30 28 16 14 10 7 3 |
Draw both ogives for the above data and hence obtain the median.
The following table gives production yield per hectare of wheat of 100 farms of a village:
| Production yield in kg per hectare: | 50 - 55 | 55 - 60 | 60 - 65 | 65 - 70 | 70 - 75 | 75 - 80 |
| Number of farms: | 2 | 8 | 12 | 24 | 38 | 16 |
Draw ‘less than’ ogive and ‘more than’ ogive.
Draw a cumulative frequency curve (ogive) for the following distributions:
| Class Interval | 10 – 15 | 15 – 20 | 20 – 25 | 25 – 30 | 30 – 35 | 35 – 40 |
| Frequency | 10 | 15 | 17 | 12 | 10 | 8 |
Find the correct answer from the alternatives given.
Cumulative frequencies in a grouped frequency table are useful to find ______.
The marks obtained by 100 students of a class in an examination are given below.
| Marks | No. of students |
| 0-5 | 2 |
| 5-10 | 5 |
| 10-15 | 6 |
| 15-20 | 8 |
| 20-25 | 10 |
| 25-30 | 25 |
| 30-35 | 20 |
| 35-40 | 18 |
| 40-45 | 4 |
| 45-50 | 2 |
Draw 'a less than' type cumulative frequency curves (orgive). Hence find median
Using a graph paper, drawn an Ogive for the following distribution which shows a record of the weight in kilograms of 200 students.
| Weight | Frequency |
| 40 - 45 | 5 |
| 45 - 50 | 17 |
| 50 - 55 | 22 |
| 55 - 60 | 45 |
| 60 - 65 | 51 |
| 65 - 70 | 31 |
| 70 - 75 | 20 |
| 75 - 80 | 9 |
Use your ogive to estimate the following:
(i) The percentage of students weighing 55kg or more.
(ii) The weight above which the heaviest 30% of the students fall.
(iii) The number of students who are:
(1) under-weight and
(2) over-weight, if 55·70 kg is considered as standard weight.
The frequency distribution of scores obtained by 230 candidates in a medical entrance test is as ahead:
| Cost of living Index | Number of Months |
| 400 - 450 | 20 |
| 450 - 500 | 35 |
| 500 - 550 | 40 |
| 550 - 600 | 32 |
| 600 - 650 | 24 |
| 650 - 700 | 27 |
| 700 - 750 | 18 |
| 750 - 800 | 34 |
| Total | 230 |
Draw a cummulative polygon (ogive) to represent the above data.
Cumulative frequency curve is also called ______.
