Advertisements
Advertisements
प्रश्न
The marks obtained by 100 students in a Mathematics test are given below:
| Marks | 0-10 | 10-20 | 20-30 | 30-40 | 40-50 | 50-60 | 60-70 | 70-80 | 80-90 | 90-100 |
| No. of students |
3 | 7 | 12 | 17 | 23 | 14 | 9 | 6 | 5 | 4 |
Draw an ogive for the given distribution on a graph sheet.
Use a scale of 2 cm = 10 units on both axes.
Use the ogive to estimate the:
1) Median.
2) Lower quartile.
3) A number of students who obtained more than 85% marks in the test.
4) A number of students who did not pass in the test if the pass percentage was 35.
Advertisements
उत्तर
Draw the cumulative frequency table.
| Marks | Number of Students (Frequency) | Cumulative Frequency |
| 0-10 | 3 | 3 |
| 10-20 | 7 | 10 |
| 20-30 | 12 | 22 |
| 30-40 | 17 | 39 |
| 40-50 | 23 | 62 |
| 50-60 | 14 | 76 |
| 60-70 | 9 | 85 |
| 70-80 | 6 | 91 |
| 80-90 | 5 | 96 |
| 90-100 | 4 | 100 |
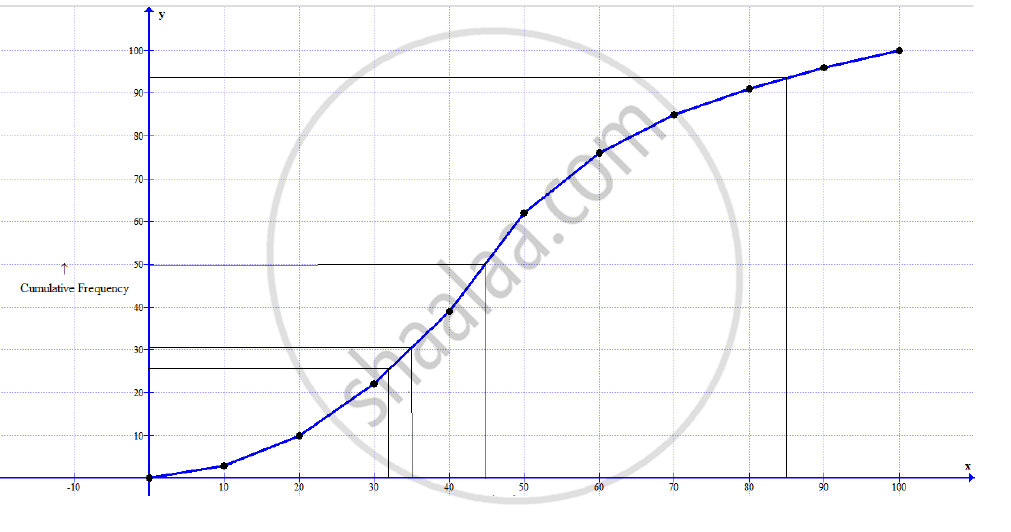
Scale: On x-axis, 1 unit = 10 marks, On y-axis, 1 unit = 10 students
1) Median = `(N/2)^"th" term = (100/2)^"th" term = 50^"th term"`
Draw a horizontal line through mark 50 on the y-axis. The, draw a vertical line from the point it cuts on the graph. The point this line touches the x-axis is the median. Thus, median = 45
2) Lower quartile = `(N/4)^"th" term = (100/4)^"th" term = 25^"th term"`
Draw a horizontal line through mark 25 on the y-axis. The, draw a vertical line from the point it cuts on the graph. The point this line touches the x-axis is the lower quartile
Thus, lower quartile = 31
3) Draw a vertical line through mark 85 on the x-axis. Then, draw a horizontal line from the point it cuts on the graph.
The point where this line touches the y-axis is the number of students who obtained less than 85% marks =93
Thus, number of students who obtained more than 85% marks =100 – 93 = 7
4) Draw a vertical line through mark 35 on the x-axis. The, draw a horizontal line from the point it cuts on the graph.
The point where this line touches the y-axis is the number of students who obtained less than 35% marks = 21
APPEARS IN
संबंधित प्रश्न
The daily wages of 80 workers in a project are given below.
| Wages (in Rs.) |
400-450 | 450-500 | 500-550 | 550-600 | 600-650 | 650-700 | 700-750 |
| No. of workers |
2 | 6 | 12 | 18 | 24 | 13 | 5 |
Use a graph paper to draw an ogive for the above distribution. (Use a scale of 2 cm = Rs. 50 on x-axis and 2 cm = 10 workers on y-axis). Use your ogive to estimate:
- the median wage of the workers.
- the lower quartile wage of workers.
- the numbers of workers who earn more than Rs. 625 daily.
Draw an ogive by less than method for the following data:
| No. of rooms: | 1 | 2 | 3 | 4 | 5 | 6 | 7 | 8 | 9 | 10 |
| No. of houses: | 4 | 9 | 22 | 28 | 24 | 12 | 8 | 6 | 5 | 2 |
Draw a cumulative frequency curve (ogive) for the following distributions:
| Class Interval | 10 – 15 | 15 – 20 | 20 – 25 | 25 – 30 | 30 – 35 | 35 – 40 |
| Frequency | 10 | 15 | 17 | 12 | 10 | 8 |
Construct a frequency distribution table for the following distributions:
| Marks (less than) | 0 | 10 | 20 | 30 | 40 | 50 | 60 | 70 | 80 | 90 | 100 |
| Cumulative frequency | 0 | 7 | 28 | 54 | 71 | 84 | 105 | 147 | 180 | 196 | 200 |
Construct a frequency distribution table for the following distributions:
| Marks (more than) | 0 | 10 | 20 | 30 | 40 | 50 | 60 | 70 | 80 | 90 | 100 |
| Cumulative frequency | 100 | 87 | 65 | 55 | 42 | 36 | 31 | 21 | 18 | 7 | 0 |
Draw an ogive for the following :
| Class Interval | 0-10 | 10-20 | 20-30 | 30-40 | 40-50 |
| Frequency | 8 | 12 | 10 | 14 | 6 |
Draw an ogive for the following :
| Class Interval | 10-19 | 20-29 | 30-39 | 40-49 | 50-59 |
| Frequency | 28 | 23 | 15 | 20 | 14 |
Draw an ogive for the following:
| Marks obtained | Less than 10 | Less than 20 | Less than 30 | Less than 40 | Less than 50 |
| No. of students | 8 | 22 | 48 | 60 | 75 |
Find the width of class 35 - 45.
Use graph paper for this question. The following table shows the weights in gm of a sample of 100 potatoes taken from a large consignment:
| Weight (gms) | Frequency |
| 50 - 60 | 8 |
| 60 - 70 | 10 |
| 70 - 80 | 12 |
| 80 - 90 | 16 |
| 90 - 100 | 18 |
| 100 - 110 | 14 |
| 110 - 120 | 12 |
| 120 - 130 | 10 |
(i) Calculate the cumulative frequencies.
(ii) Draw the cumulative frequency curve and form it determine the median weights of the potatoes.
