Advertisements
Advertisements
प्रश्न
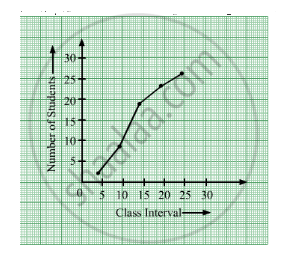
Draw an ogive to represent the following frequency distribution:
| Class-interval: | 0 - 4 | 5 - 9 | 10 - 14 | 15 - 19 | 20 - 24 |
| Frequency: | 2 | 6 | 10 | 5 | 3 |
Advertisements
उत्तर
Firstly, prepare the cumulative frequency table.
| Class Interval | No. of students | Less than | Cumulative frequency | Suitable points |
| 0-4 | 2 | 4 | 2 | (4, 2) |
| 5-9 | 6 | 9 | 8 | (9, 8) |
| 10-14 | 10 | 14 | 18 | (14, 18) |
| 15-19 | 5 | 19 | 23 | (19, 23) |
| 20-24 | 3 | 24 | 26 | (24, 26) |
Now, plot the less than ogive using the suitable points.
shaalaa.com
क्या इस प्रश्न या उत्तर में कोई त्रुटि है?
