Advertisements
Advertisements
Question
Marks obtained by 200 students in an examination are given below:
| Marks | No. of students |
| 0 – 10 | 5 |
| 10 – 20 | 11 |
| 20 – 30 | 10 |
| 30 – 40 | 20 |
| 40 – 50 | 28 |
| 50 – 60 | 37 |
| 60 – 70 | 40 |
| 70 – 80 | 29 |
| 80 – 90 | 14 |
| 90 – 100 | 6 |
Draw an ogive for the given distribution taking 2 cm = 10 marks on one axis and 2 cm = 20 students on the other axis. Using the graph, determine:
- The median marks.
- The number of students who failed if minimum marks required to pass is 40.
- If scoring 85 and more marks are considered as grade one, find the number of students who secured grade one in the examination.
Advertisements
Solution 1
| Marks | No. of students (f) |
cf |
| 0 – 10 | 5 | 5 |
| 10 – 20 | 11 | 16 |
| 20 – 30 | 10 | 26 |
| 30 – 40 | 20 | 46 |
| 40 – 50 | 28 | 74 |
| 50 – 60 | 37 | 111 |
| 60 – 70 | 40 | 151 |
| 70 – 80 | 29 | 180 |
| 80 – 90 | 14 | 194 |
| 90 – 100 | 6 | 200 |
The ogive can be drawn as follows:
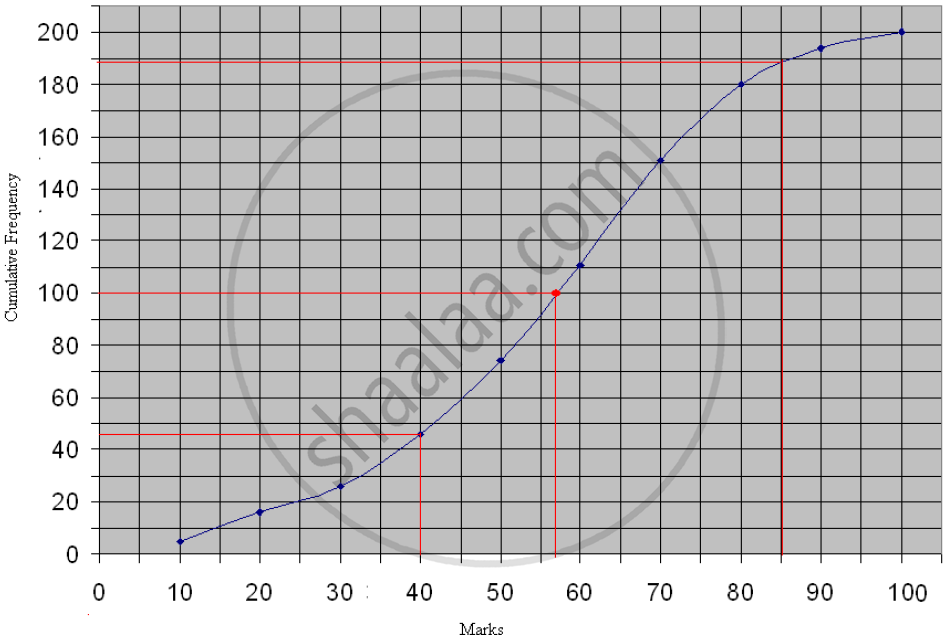
i. Median marks will be 57.5 as the x coordinate corresponding to n/2 i.e., 100 is 57.5.
ii. The number of students who failed (if minimum marks required to pass is 40) = 46 (approx from the graph)
iii. Number of students who secured more than 85 marks (grade one) = Total number of students – 188 = 200 – 188 = 12
Solution 2
1. Construct the cumulative frequency table
To draw an ogive, first calculate the cumulative frequency (CF) by adding each frequency to the sum of the preceding ones.
| Marks (Class Interval) |
No. of Students (f) |
Cumulative Frequency (CF) |
| 0 – 10 | 5 | 5 |
| 10 – 20 | 11 | 16 |
| 20 – 30 | 10 | 26 |
| 30 – 40 | 20 | 46 |
| 40 – 50 | 28 | 74 |
| 50 – 60 | 37 | 111 |
| 60 – 70 | 40 | 151 |
| 70 – 80 | 29 | 180 |
| 80 – 90 | 14 | 194 |
| 90 – 100 | 6 | 200 |
2. Plot the Ogive
Use the upper class limits for the x-axis and cumulative frequencies for the y-axis.
Scale: 2 cm = 10 marks on the x-axis; 2 cm = 20 students on the y-axis.
Points to plot: (10, 5), (20, 16), (30, 26), (40, 46), (50, 74), (60, 111), (70, 151), (80, 180), (90, 194), (100, 200).
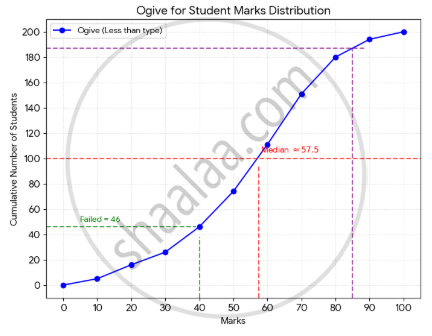
3. Determine the values from the graph
1. Median Marks: Since the total number of students (N) is 200, the median is the `N/2` = 100th term. Locate 100 on the y-axis, draw a horizontal line to the curve and then a vertical line down to the x-axis. The value is approximately 57.5 marks.
2. Number of Failures: Locate 40 marks on the x-axis. Draw a vertical line to the curve and then a horizontal line to the y-axis. The corresponding value is 46, meaning 46 students scored less than 40.
3. Grade One (85+ marks): Locate 85 marks on the x-axis. The corresponding cumulative frequency on the curve is approximately 187. This means 187 students scored below 85.
Number of students with 85 or more marks = 200 – 187 = 13 students.
The median marks are 57.5.
The number of students who failed (scored less than 40) is 46.
The number of students who secured grade one (scored 85 or more) is 13.
