Advertisements
Advertisements
Question
The marks obtained by 120 students in a Mathematics test are given below:
| Marks | 0-10 | 10-20 | 20-30 | 30-40 | 40-50 | 50-60 | 60-70 | 70-80 | 80-90 | 90-100 |
| No. of students | 5 | 9 | 16 | 22 | 26 | 16 | 11 | 6 | 4 | 3 |
Draw an ogive for the given distribution on a graph sheet. Use a suitable scale for ogive to estimate the following:
- The median.
- The number of students who obtained more than 75% marks in the test.
- The number of students who did not pass in the test if the pass percentage was 40.
Advertisements
Solution
1. Construct the cumulative frequency table
To draw an ogive (less than type), calculate the cumulative frequency by adding each class frequency to the sum of the preceding ones.
| Marks (Upper Limit) |
No. of Students (f) |
Cumulative Frequency (cf) |
| Less than 10 | 5 | 5 |
| Less than 20 | 9 | 14 (5 + 9) |
| Less than 30 | 16 | 30 (14 + 16) |
| Less than 40 | 22 | 52 (30 + 22) |
| Less than 50 | 26 | 78 (52 + 26) |
| Less than 60 | 16 | 94 (78 + 16) |
| Less than 70 | 11 | 105 (94 + 11) |
| Less than 80 | 6 | 111 (105 + 6) |
| Less than 90 | 4 | 115 (111 + 4) |
| Less than 100 | 3 | 118 (115 + 3) |
2. Draw the Ogive
1. Scale Selection: Plot “Marks” on the x-axis (e.g., 1 cm = 10 units) and “No. of Students” on the y-axis (e.g., 1 cm = 10 units).
2. Plotting: Mark points using (Upper Limit, cf): (10, 5), (20, 14), ..., (100, 118).
3. Curve: Join the points with a smooth, free-hand curve starting from the lower limit of the first class (0, 0).
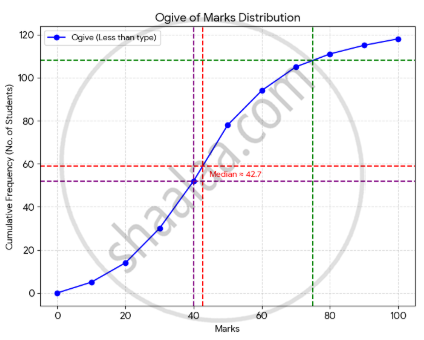
3. Estimate required values
The Median: Locate `N/2 = 118/2 = 59` on the y-axis. Draw a horizontal line to the curve, then drop a vertical line to the x-axis. The point is approximately 43.
More than 75% marks: 75% of 100 is 75 marks. Find 75 on the x-axis, move up to the curve, and across to the y-axis to find the cf (approx. 108). Subtract this from the total: 118 – 108 = 10 students.
Failed Students: For a pass percentage of 40% (40 marks), find 40 on the x-axis and move to the y-axis. The corresponding cumulative frequency is 52 students.
The estimated median is 43 marks 10 students scored more than 75% and 52 students failed with a pass mark of 40.
