Advertisements
Advertisements
Question
Show on a graph, the variation of resistivity with temperature for a typical semiconductor.
Advertisements
Solution
The following curve shows the variation of resistivity with temperature for a typical semiconductor.

This is because, for a semiconductor, resistivity decreases rapidly with increasing temperature.
APPEARS IN
RELATED QUESTIONS
With the help of neat labelled circuit diagram explain the working of half wave rectifier using semiconductor diode. Draw the input and output waveforms.
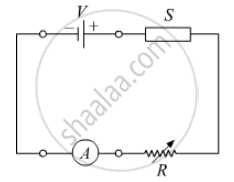
In the following diagram 'S' is a semiconductor. Would you increase or decrease the value of R to keep the reading of the ammeter A constant when S is heated? Give reason for your answer.
Answer the following question.
Why photodiodes are required to operate in reverse bias? Explain.
Basic materials used in the present solid state electronic devices like diode, transistor, ICs, etc are ______.
When an electric field is applied across a semiconductor ______.
- electrons move from lower energy level to higher energy level in the conduction band.
- electrons move from higher energy level to lower energy level in the conduction band.
- holes in the valence band move from higher energy level to lower energy level.
- holes in the valence band move from lower energy level to higher energy level.
Consider an npn transistor with its base-emitter junction forward biased and collector base junction reverse biased. Which of the following statements are true?
- Electrons crossover from emitter to collector.
- Holes move from base to collector.
- Electrons move from emitter to base.
- Electrons from emitter move out of base without going to the collector.
In the depletion region of a diode ______.
- there are no mobile charges.
- equal number of holes and electrons exist, making the region neutral.
- recombination of holes and electrons has taken place.
- immobile charged ions exist.
Differentiate between the threshold voltage and the breakdown voltage for a diode.
A semiconductor device is connected in series with a battery, an ammeter and a resistor. A current flows in the circuit. If. the polarity of the battery is reversed, the current in the circuit almost becomes zero. The device is a/an ______.
With reference to a semiconductor diode, define the depletion region.
