Advertisements
Advertisements
Question
For a chemical reaction R → P, the variation in the concentration (R) vs. time (t) plot is given as:
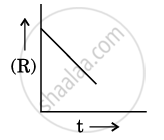
(i) Predict the order of the reaction.
(ii) What is the slope of the curve?
(iii) Write the unit of rate constant for this reaction.
Advertisements
Solution 1
For a chemical reaction R→P, the variation in the concentration (R) vs. time (t) plot is given as follows:
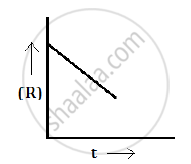
(i) The order of the reaction zero.
(ii) Slope = -k
Solution 2
(i) Predict the order of the reaction
The graph shows a straight line when concentration of reactant R is plotted against time t.
[R] = [R]0 − kt
Since the plot is a straight line with a negative slope, the reaction is zero order.
(ii) Slope of the curve
From the zero-order equation:
[R] = [R]0 − kt
The slope of the [R] vs t graph is −k (negative of the rate constant).
(iii) Unit of rate constant
For a zero-order reaction:
Rate = k
Rate has units of concentration/time.
If concentration is in mol L−1 and time in seconds:
Unit of k = mol L−1s−1
APPEARS IN
RELATED QUESTIONS
A reaction is second order in A and first order in B.
(i) Write the differential rate equation.
(ii) How is the rate affected on increasing the concentration of A three times?
(iii) How is the rate affected when the concentrations of both A and B are doubled?
What is pseudo first order reaction? Give one· example of it.
A reaction is first order in A and second order in B. Write the differential rate equation.
Write the principle behind the following methods of refining:
Hydraulic washing
Which of the following statement is true for order of a reaction?
For a general reaction A → B, plot of concentration of A vs time is given in figure. Answer the following question on the basis of this graph.
(i) What is the order of the reaction?
(ii) What is the slope of the curve?
(iii) What are the units of rate constant?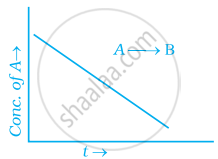
Why molecularity is applicable only for elementary reactions and order is applicable for elementary as well as complex reactions?
Assertion: Order of the reaction can be zero or fractional.
Reason: We cannot determine order from balanced chemical equation.
Assertion: Rate constants determined from Arrhenius equation are fairly accurate for simple as well as complex molecules.
Reason: Reactant molecules undergo chemical change irrespective of their orientation during collision.
For a first order A → B, the reaction rate at reactant concentration of 0.01 m is found to be 2.0 × 10⁻⁵. The half-life period of reaction.
