Advertisements
Advertisements
Question
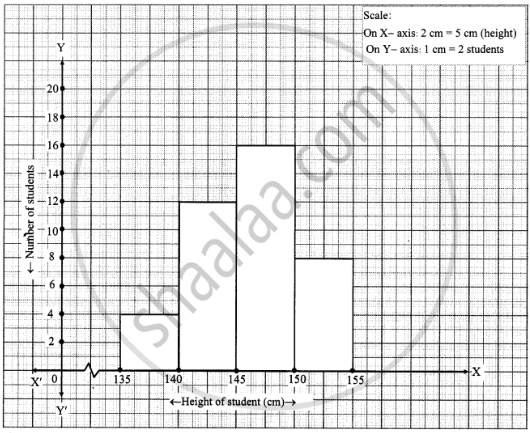
Draw a histogram of the following data.
| Height of student (cm) | 135 - 140 | 140 - 145 | 145 - 150 | 150 - 155 |
| No. of students | 4 | 12 | 16 | 8 |
Advertisements
Solution
APPEARS IN
RELATED QUESTIONS
The marks scored by students in Mathematics in a certain Examination are given below:
| Marks Scored | Number of Students |
| 0 — 20 | 3 |
| 20 — 40 | 8 |
| 40 — 60 | 19 |
| 60 — 80 | 18 |
| 80 — 100 | 6 |
Draw histogram for the above data.
Find the correct answer from the alternatives given.
|
No. of trees planted by each student |
1 - 3 | 4 - 6 | 7 - 9 | 10 - 12 |
| No. of students | 7 | 8 | 6 | 4 |
The above data is to be shown by a frequency polygon. The coordinates of the points to show number of students in the class 4-6 are . . . .
Number of workshops organized by a school in different areas during the last five years are as follows:
| Years | No. of workshops |
| 1995−1996 | 25 |
| 1996−1997 | 30 |
| 1997−1998 | 42 |
| 1998−1999 | 50 |
| 1999−2000 | 65 |
Draw a histogram representing the above data.
In a hypothetical sample of 20 people the amounts of money with them were found to be as follows:
114, 108, 100, 98, 101, 109, 117, 119, 126, 131, 136, 143, 156, 169, 182, 195, 207, 219, 235, 118.
Draw the histogram of the frequency distribution (taking one of the class intervals as 50 − 100).
Draw a histogram to represent the following data:
| Monthly salary (in Rs) | Number of teachers |
| 5600−5700 | 8 |
| 5700−5800 | 4 |
| 5800−5900 | 3 |
| 5900−6000 | 5 |
| 6000−6100 | 2 |
| 6100−6200 | 3 |
| 6200−6300 | 1 |
| 6300−6400 | 2 |
Construct histograms for following frequency distribution:
| Class Interval | 0-10 | 10-20 | 20-30 | 30-40 | 40-50 | 50-60 |
| Frequency | 8 | 20 | 34 | 22 | 10 | 6 |
Following table present educational level (middle stage) of females in Arunachal pradesh according to 1981 census:
| Age group | Number of females (to the nearest ten) |
| 10 - 14 | 300 |
| 15 - 19 | 980 |
| 20 - 24 | 800 |
| 25 - 29 | 380 |
| 30 - 34 | 290 |
Draw a histogram to represent the above data.
Draw a histogram and frequency polygon to represent the following data (on the same scale) which shows the monthly cost of living index of a city in a period of 2 years:
| Cost of living Index | Number of months |
| 440 - 460 | 2 |
| 460 - 480 | 4 |
| 480 - 500 | 3 |
| 500 - 520 | 5 |
| 520 - 540 | 3 |
| 540 - 560 | 2 |
| 560 - 580 | 1 |
| 580 - 600 | 4 |
| Total | 24 |
(Use a graph paper for this question.) The daily pocket expenses of 200 students in a school are given below:
| Pocket expenses (in ₹) |
Number of students (frequency) |
| 0 - 5 | 10 |
| 5 - 10 | 14 |
| 10 - 15 | 28 |
| 15 - 20 | 42 |
| 20 - 25 | 50 |
| 25 - 30 | 30 |
| 30 - 35 | 14 |
| 35 - 40 | 12 |
Draw a histogram representing the above distribution and estimate the mode from the graph.
Identify the following data can be represented in a histogram?
The number of mountain climbers in the age group 20 to 60 in Tamil Nadu.
Identify the following data can be represented in a histogram?
The number of students in each class of a school
Identify the following data can be represented in a histogram?
The number of votes polled from 7 am to 6 pm in an election
Construct a histogram from the following distribution of total marks of 40 students in a class.
| Marks | 90 − 110 | 110 − 130 | 130 − 150 | 150 − 170 | 170 − 190 | 190 − 210 |
| No. of Students | 9 | 5 | 10 | 7 | 4 | 6 |
The marks obtained by 50 students in Mathematics are given below.
(i) Make a frequency distribution table taking a class size of 10 marks
(ii) Draw a histogram and a frequency polygon.
| 52 | 33 | 56 | 52 | 44 | 59 | 47 | 61 | 49 | 61 |
| 47 | 52 | 67 | 39 | 89 | 57 | 64 | 58 | 63 | 65 |
| 32 | 64 | 50 | 54 | 42 | 48 | 22 | 37 | 59 | 63 |
| 36 | 35 | 48 | 48 | 55 | 62 | 74 | 43 | 41 | 51 |
| 08 | 71 | 30 | 18 | 43 | 28 | 20 | 40 | 58 | 49 |
Histogram shows the number of people owning the different number of books. Answer the question based on it.

The number of people owning books less than 40 is ______.
Histogram shows the number of people owning the different number of books. Answer the question based on it.

The number of people having books more than 20 and less than 40 is ______.
From the histogram given on the right, we can say that 1500 males above the age of 20 are literate.

The following pictorial representation of data is a histogram.

The following histogram shows the frequency distribution of teaching experiences of 30 teachers in various schools:

- What is the class width?
- How many teachers are having the maximum teaching experience and how many have the least teaching experience?
- How many teachers have teaching experience of 10 to 20 years?
