Advertisements
Advertisements
प्रश्न
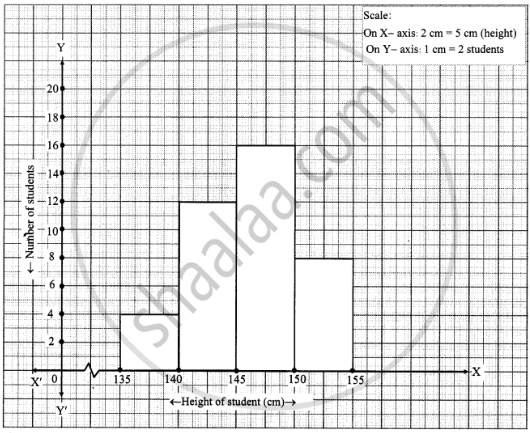
Draw a histogram of the following data.
| Height of student (cm) | 135 - 140 | 140 - 145 | 145 - 150 | 150 - 155 |
| No. of students | 4 | 12 | 16 | 8 |
Advertisements
उत्तर
APPEARS IN
संबंधित प्रश्न
The weekly wages (in Rs) of 30 workers in a factory are.
830, 835, 890, 810, 835, 836, 869, 845, 898, 890, 820, 860, 832, 833, 855, 845, 804, 808, 812, 840, 885, 835, 835, 836, 878, 840, 868, 890, 806, 840
Using tally marks make a frequency table with intervals as 800 − 810, 810 − 820 and so on.
Draw histogram and frequency polygon on the same graph paper for the following frequency distribution
| Class | Frequency |
| 15-20 | 20 |
| 20-25 | 30 |
| 25-30 | 50 |
| 30-35 | 40 |
| 35-40 | 25 |
| 40-45 | 10 |
Draw histogram for the following frequency distributions:
| Class Marks | 16 | 24 | 32 | 40 | 48 | 56 | 64 |
| Frequency | 8 | 12 | 15 | 18 | 25 | 19 | 10 |
The following table shows the investment made by some families. Show
the information by a histogran.
| Investment (Thousand Rupees) |
10-15 | 15-20 | 20-25 | 25-30 | 30-35 |
| No. of families | 30 | 50 | 60 | 55 | 15 |
Draw a histogram for the daily earnings of 30 drug stores in the following table:
| Daily earnings (in Rs): | 450−500 | 500−550 | 550−600 | 600−650 | 650−700 |
| Numbers of stores: | 16 | 10 | 7 | 3 | 1 |
The following histogram shows the monthly wages (in Rs) of workers in a factory:
(i) In which wage-group the largest number of workers are being kept? What is their number?
(ii) What wages are the least number of workers getting? What is the number of such workers?
(iii) What is the total number of workers?
(iv) What is the factory size?
Construct histograms for following frequency distribution:
| Class Interval | 0-10 | 10-20 | 20-30 | 30-40 | 40-50 | 50-60 |
| Frequency | 8 | 20 | 34 | 22 | 10 | 6 |
Construct histograms for following frequency distribution:
| Class Interval | 110-119 | 120-129 | 130-139 | 140-149 | 150-159 |
| Frequency | 15 | 23 | 30 | 20 | 16 |
Construct a frequency polygon without using a histogram for the following frequency distribution :
| Class Interval | 1-10 | 11-20 | 21-30 | 31-40 | 41-50 |
| Frequency | 8 | 12 | 10 | 16 | 6 |
Construct a frequency polygon without using a histogram for the following frequency distribution :
| Class Interval | 10-20 | 20-40 | 40-60 | 60-80 | 80-100 |
| Frequency | 9 | 17 | 15 | 20 | 14 |
Distribution of height in cm of 100 people is given below:
| Class interval (cm) | Frequency |
| 145 - 155 | 3 |
| 155 - 165 | 35 |
| 165 - 175 | 25 |
| 175 - 185 | 15 |
| 185 - 195 | 20 |
| 195 - 205 | 2 |
Draw a histogram to represent the above data.
Identify the following data can be represented in a histogram?
The number of mountain climbers in the age group 20 to 60 in Tamil Nadu.
Identify the following data can be represented in a histogram?
Production of cycles in different years
The marks obtained by 50 students in Mathematics are given below.
(i) Make a frequency distribution table taking a class size of 10 marks
(ii) Draw a histogram and a frequency polygon.
| 52 | 33 | 56 | 52 | 44 | 59 | 47 | 61 | 49 | 61 |
| 47 | 52 | 67 | 39 | 89 | 57 | 64 | 58 | 63 | 65 |
| 32 | 64 | 50 | 54 | 42 | 48 | 22 | 37 | 59 | 63 |
| 36 | 35 | 48 | 48 | 55 | 62 | 74 | 43 | 41 | 51 |
| 08 | 71 | 30 | 18 | 43 | 28 | 20 | 40 | 58 | 49 |
Histogram is a graph of a ________ frequency distribution
Draw a histogram for the following data.
| Mid Value (x) | 15 | 25 | 35 | 45 | 55 | 65 | 75 |
| Frequency (f) | 12 | 24 | 30 | 18 | 26 | 10 | 8 |
Histogram shows the number of people owning the different number of books. Answer the question based on it.

The total number of people surveyed is ______.
Histogram shows the number of people owning the different number of books. Answer the question based on it.

The number of people owning books less than 40 is ______.
Draw a histogram to represent the frequency distribution in question 91.
The table given below shows the runs scored by a cricket team during the overs of a match.
| Overs | Runs scored |
| 20 – 30 | 37 |
| 30 – 40 | 45 |
| 40 – 50 | 40 |
| 50 – 60 | 60 |
| 60 – 70 | 51 |
| 70 – 80 | 35 |
Use graph sheet for this question.
Take 2 cm = 10 overs along one axis and 2 cm = 10 runs along the other axis.
- Draw a histogram representing the above distribution.
- Estimate the modal runs scored.
