Advertisements
Advertisements
प्रश्न
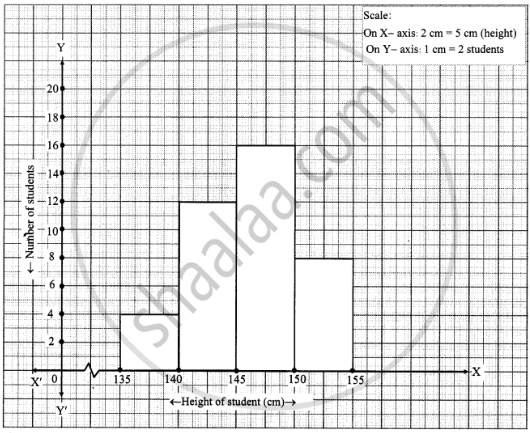
Draw a histogram of the following data.
| Height of student (cm) | 135 - 140 | 140 - 145 | 145 - 150 | 150 - 155 |
| No. of students | 4 | 12 | 16 | 8 |
Advertisements
उत्तर
APPEARS IN
संबंधित प्रश्न
The shoppers who come to a departmental store are marked as: man (M), woman (W), boy (B) or girl (G). The following list gives the shoppers who came during the first hour in the morning
W W W G B W W M G G M M W W W W G B M W B G G M W W M M W W W M W B W G M W W W W G W M M W W M W G W M G W M M B G G W
Make a frequency distribution table using tally marks. Draw a bar graph to illustrate it.
The number of hours for which students of a particular class watched television during holidays is shown through the given graph.
Answer the following
1) For how many hours did the maximum number of students watch TV?
2) How many students watched TV for less than 4 hours?
3) How many students spent more than 5 hours in watching TV?

A Mathematics aptitude test of 50 students was recorded as follows:
| Marks | 50 - 60 | 60 - 70 | 70 - 80 | 80 - 90 | 90 – 100 |
| No. of Students | 4 | 8 | 14 | 19 | 5 |
Draw a histogram from the above data using a graph paper and locate the mode.
Draw histogram for the following frequency distributions:
| Class Interval | 0 – 10 | 10 – 20 | 20 – 30 | 30 – 40 | 40 – 50 | 50 – 60 |
| Frequency | 12 | 20 | 26 | 18 | 10 | 6 |
Draw histogram for the following frequency distributions:
| Class Marks | 16 | 24 | 32 | 40 | 48 | 56 | 64 |
| Frequency | 8 | 12 | 15 | 18 | 25 | 19 | 10 |
| Result (Percentage) | 30 - 40 | 40 - 50 | 50 - 60 | 60 -70 | 70 - 80 | 80 - 90 | 90 - 100 |
| No. of students | 7 | 33 | 45 | 65 | 47 | 18 | 5 |
Construct histograms for following frequency distribution:
| Class Interval | 1-10 | 11-20 | 21-30 | 31-40 | 41-50 |
| Frequency | 11 | 23 | 30 | 20 | 16 |
Construct a frequency polygon without using a histogram for the following frequency distribution :
| Class Mark | 10 | 15 | 20 | 25 | 30 | 35 | 40 |
| Frequency | 4 | 20 | 40 | 45 | 30 | 25 | 5 |
Draw a histogram for the following frequency distribution.
|
Use of electricity (Unit)
|
50 - 70 | 70 - 90 | 90 - 110 | 110 - 130 | 130 - 150 | 150 - 170 |
| No. of families | 150 | 400 | 460 | 540 | 600 | 350 |
The total area of the histogram is _________ to the total frequency of the given data
A graph that displays data that changes continuously over the periods of time is _________
The marks obtained by 50 students in Mathematics are given below.
(i) Make a frequency distribution table taking a class size of 10 marks
(ii) Draw a histogram and a frequency polygon.
| 52 | 33 | 56 | 52 | 44 | 59 | 47 | 61 | 49 | 61 |
| 47 | 52 | 67 | 39 | 89 | 57 | 64 | 58 | 63 | 65 |
| 32 | 64 | 50 | 54 | 42 | 48 | 22 | 37 | 59 | 63 |
| 36 | 35 | 48 | 48 | 55 | 62 | 74 | 43 | 41 | 51 |
| 08 | 71 | 30 | 18 | 43 | 28 | 20 | 40 | 58 | 49 |
Form a continuous frequency distribution table and draw histogram from the following data.
| Age (in years) | No. of persons |
| Under 5 | 1 |
| Under 10 | 12 |
| Under 15 | 19 |
| Under 20 | 26 |
| Under 25 | 27 |
| Under 30 | 35 |
| Under 35 | 38 |
| Under 40 | 45 |
| Under 45 | 48 |
| Under 50 | 53 |
Represent the following data by histogram:
| Price of Sugar (per kg in ₹) | Number of Weeks |
| 18 – 20 | 4 |
| 20 – 22 | 8 |
| 22 – 24 | 22 |
| 24 – 26 | 12 |
| 26 – 28 | 6 |
| 28 – 30 | 8 |
Histogram shows the number of people owning the different number of books. Answer the question based on it.

The number of people owning books less than 40 is ______.
Histogram shows the number of people owning the different number of books. Answer the question based on it.

The number of people having books more than 20 and less than 40 is ______.
The following pictorial representation of data is a histogram.

Draw a histogram to represent the frequency distribution in question 91.
The given graph with a histogram represents the number of plants of different heights grown in a school campus. Study the graph carefully and answer the following questions:

- Make a frequency table with respect to the class boundaries and their corresponding frequencies.
- State the modal class.
- Identify and note down the mode of the distribution.
- Find the number of plants whose height range is between 80 cm to 90 cm.
