Advertisements
Advertisements
Question
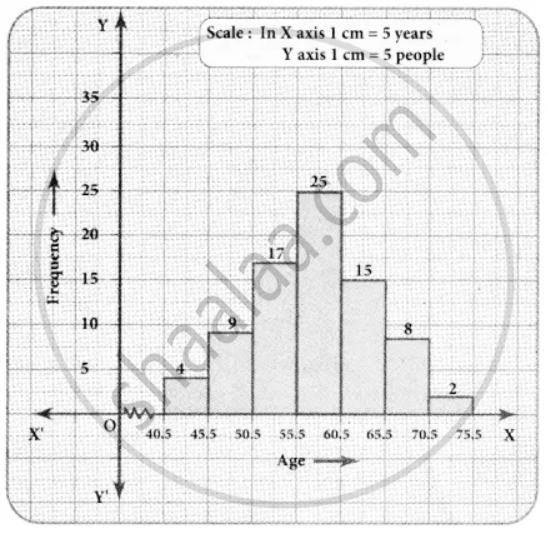
Draw a histogram for the given frequency distribution
| Age | 41 − 45 | 46 − 50 | 51 − 55 | 56 − 60 | 61 − 65 | 66 − 70 | 71 − 75 |
| Frequency | 4 | 9 | 17 | 25 | 15 | 8 | 2 |
Advertisements
Solution
The given distribution is discontinuous.
Lower boundary = lower limit – `1/2` (gap between the adjacent class interval)
= `41 - 1/2` (1) = 40.5
Upper boundary = Upper limit + `1/2` (gap between the adjacent class interval)
= `45 + 1/2` (1) = 45.5
Now continuous frequency table is as below
| Age | 40.5 − 45.5 | 45.5 − 50.5 | 50.5 − 55.5 | 55.5 − 60.5 | 60.5 − 65.5 | 65.5 − 70.5 | 70.5 − 75.5 |
| Frequency | 4 | 9 | 17 | 25 | 15 | 8 | 2 |
APPEARS IN
RELATED QUESTIONS
Draw the frequency polygon for the following frequency distribution
| Rainfall (in cm) | No. of Years |
| 20 — 25 | 2 |
| 25 — 30 | 5 |
| 30 — 35 | 8 |
| 35 — 40 | 12 |
| 40 — 45 | 10 |
| 45 — 50 | 7 |
The histogram below represents the scores obtained by 25 students in a mathematics mental test. Use the data to:
- Frame a frequency distribution table.
- To calculate mean.
- To determine the Modal class.

Draw histogram for the following frequency distributions:
| Class Marks | 16 | 24 | 32 | 40 | 48 | 56 | 64 |
| Frequency | 8 | 12 | 15 | 18 | 25 | 19 | 10 |
The age groups and the number of persons in the age groups, who donated blood in blood donation camp is given below. Find the measures of central angles to show the information by a pie diagram.
| Age group (Years) | 20-25 | 25-30 | 30-35 | 35-40 |
| No of persons | 80 | 60 | 35 | 25 |
The following histogram shows the monthly wages (in Rs) of workers in a factory:
(i) In which wage-group the largest number of workers are being kept? What is their number?
(ii) What wages are the least number of workers getting? What is the number of such workers?
(iii) What is the total number of workers?
(iv) What is the factory size?
The weekly wages (in Rs.) of 30 workers in a factory are given:
830, 835, 890, 810, 835, 836, 869, 845, 898, 890, 820, 860, 832, 833, 855, 845, 804, 808, 812, 840, 885, 835, 835, 836, 878, 840, 868, 890, 806, 840
Mark a frequency table with intervals as 800-810, 810-820 and so on, using tally marks. Also, draw a histogram and answer the following questions:
(i) Which group has the maximum number of workers?
(ii) How many workers earn Rs 850 and more?
(iii) How many workers earn less than Rs 850?
Following table present educational level (middle stage) of females in Arunachal pradesh according to 1981 census:
| Age group | Number of females (to the nearest ten) |
| 10 - 14 | 300 |
| 15 - 19 | 980 |
| 20 - 24 | 800 |
| 25 - 29 | 380 |
| 30 - 34 | 290 |
Draw a histogram to represent the above data.
Draw a histogram and frequency polygon to represent the following data (on the same scale) which shows the monthly cost of living index of a city in a period of 2 years:
| Cost of living Index | Number of months |
| 440 - 460 | 2 |
| 460 - 480 | 4 |
| 480 - 500 | 3 |
| 500 - 520 | 5 |
| 520 - 540 | 3 |
| 540 - 560 | 2 |
| 560 - 580 | 1 |
| 580 - 600 | 4 |
| Total | 24 |
Draw a histogram to represent the following data:
| Pocket money in ₹ | No. of Students |
| 150 - 200 | 10 |
| 200 - 250 | 5 |
| 250 - 300 | 7 |
| 300 - 350 | 4 |
| 350 - 400 | 3 |
The table given below shows the runs scored by a cricket team during the overs of a match.
| Overs | Runs scored |
| 20 – 30 | 37 |
| 30 – 40 | 45 |
| 40 – 50 | 40 |
| 50 – 60 | 60 |
| 60 – 70 | 51 |
| 70 – 80 | 35 |
Use graph sheet for this question.
Take 2 cm = 10 overs along one axis and 2 cm = 10 runs along the other axis.
- Draw a histogram representing the above distribution.
- Estimate the modal runs scored.
